Imbalanced Data란?
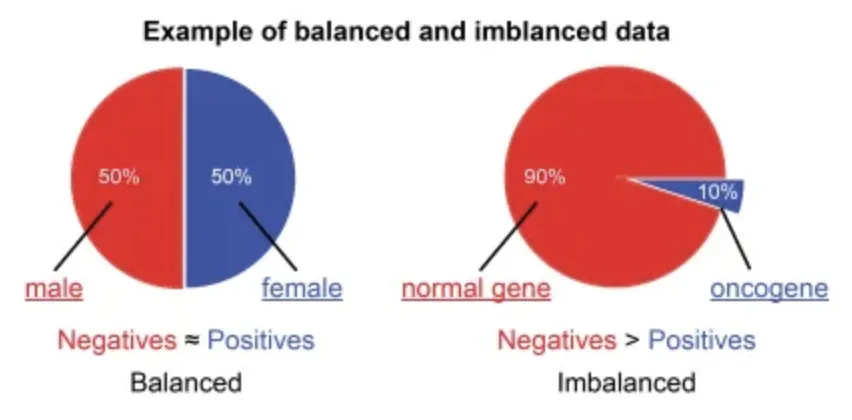
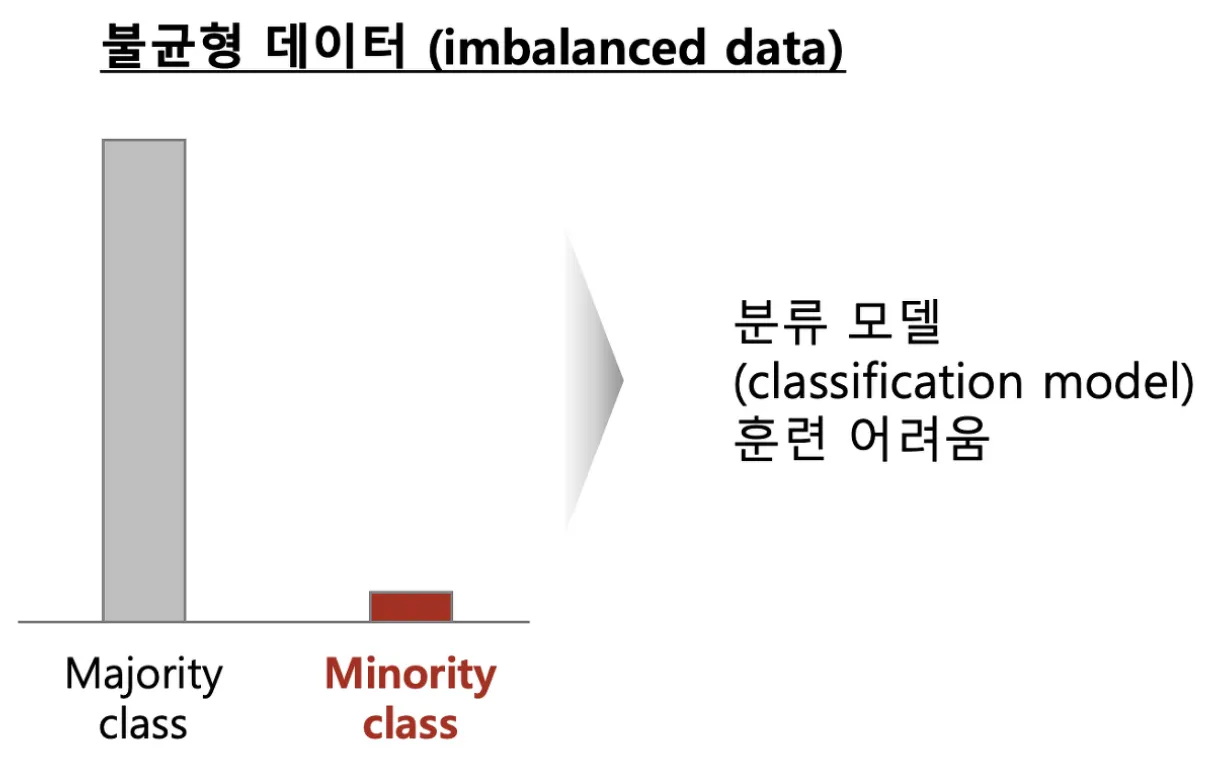
불균형 데이터는(Imbalanced Data]는 목표변수(Target)가 범주형 데이터일 때, 범주별로 관측치의 개수, 비율의 차이가 많이 나는 데이터를 말합니다.
아래는 각 산업별 예시들
•
제조회사에서 양품 대 불량품
•
신용카드회사에서 정상 거래 대 사기 거래
•
은행의 정상 거래 대 돈세탁 거래
•
의료검진센터에서 장상 대 암 진단
•
사이버보안 회사에서 정상IP 대 비정상IP
•
통신회사에서 유지 고객 대 이탈 고객
•
설비/장비의 정상 대 이상 운영
•
유통회사 대리점의 정상 대 비정상 거래
불균형 데이터를 이용한 모델링시 문제점
•
소수 집단(Minority Class)의 관측치 개수가 적으면 소수 집단의 모집단 분포를 샘플링한 소수의 관측치가 대표하기에는 부족하므로 분류 모델이 과적합(Overfitting)에 빠질 위함이 있습니다.
•
비정상(Minority Class)를 제대로 분류하지를 못하는 모델일 수 있습니다.
◦
정상(Majority Class) : 비정상(Minority Class)의 비율이 99:1이라고 한다면, 모델이 정상(Majority Class)만 학습을 하여도 정확도가 99%가 됩니다.
•
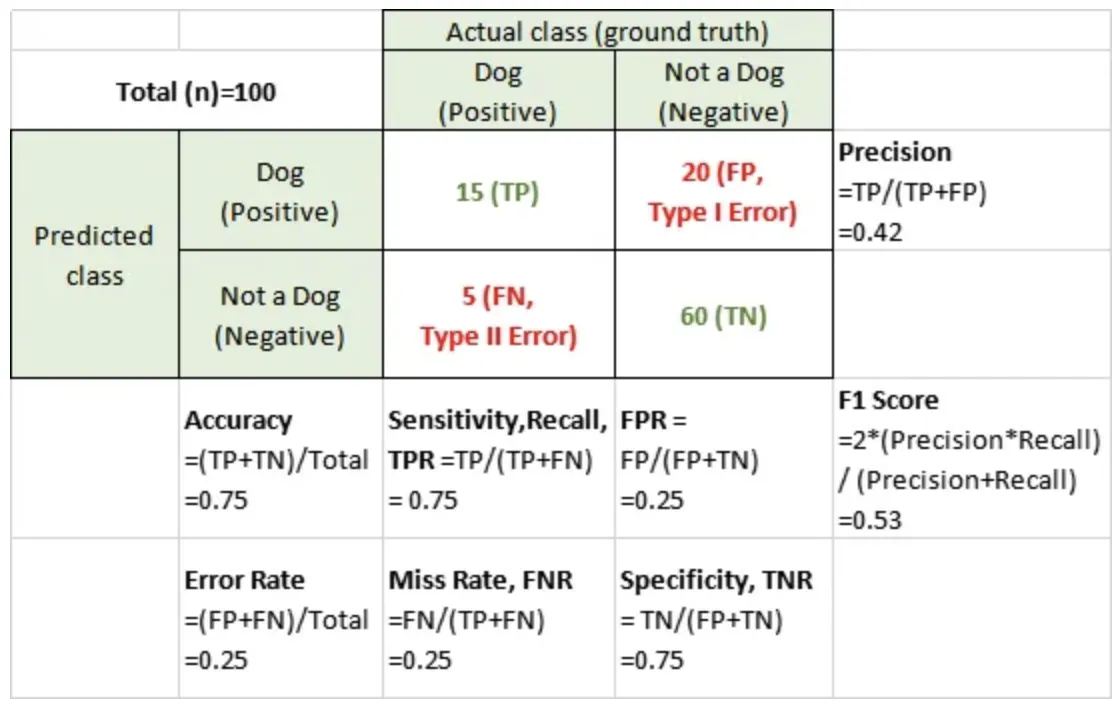
Confusion Matrix
◦
예측 결과를 테이블 형태로 보여준다.
•
Precision
◦
Positive 클래스에 속한다고 출력한 샘플 중 실제로 Positive 클래스에 속하는 샘플 수의 비율
•
Recall
◦
실제 Positive 클래스에 속한 샘플 중에 Positive 클래스에 속한다고 출력한 표본의 수
•
F1 Score
◦
정밀도(Precision)과 재현율(Recall)의 가중 조화 평균
•
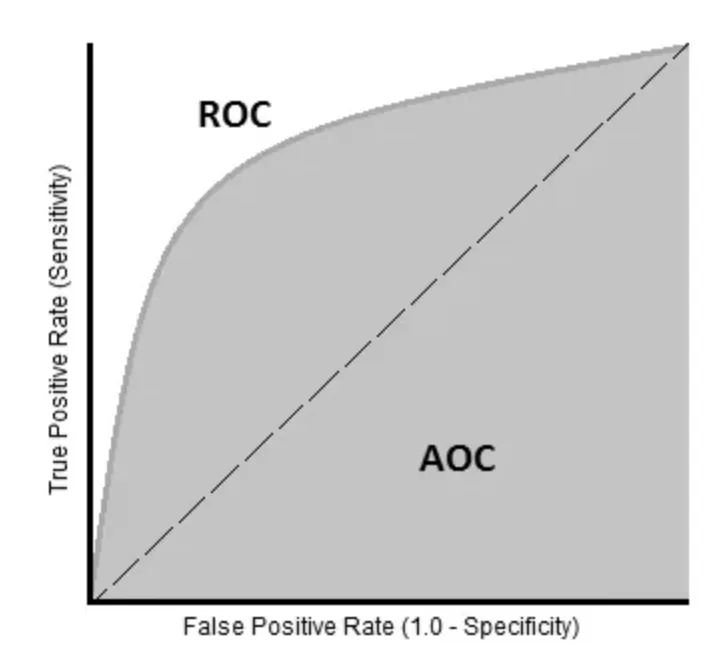
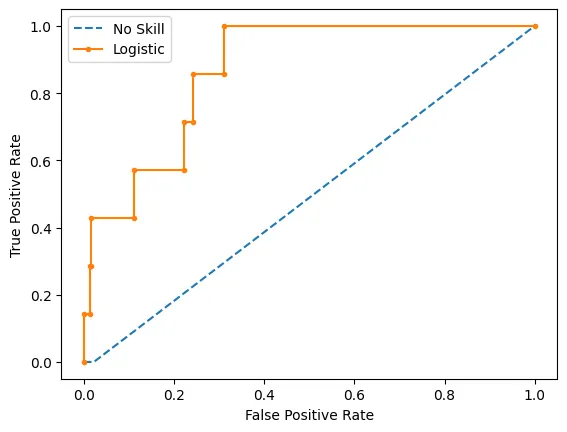
ROC Curves
◦
ROC(Receiver Operator Characteristic) 커브는 클래스 판별 기준값의 변화에 따른 위양성률(fall-out)과 재현율(recall)의 변화를 시각화한 것이다.
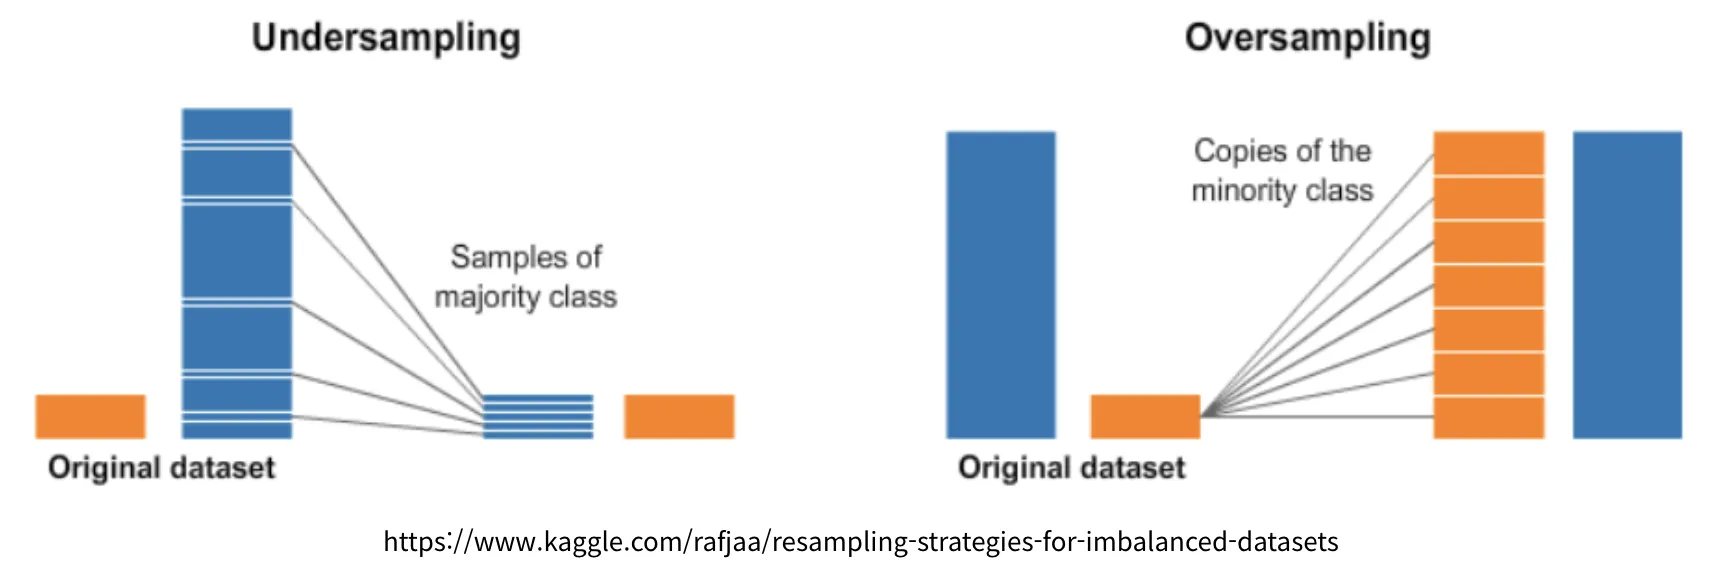
Resampling
•
오버샘플링(Over-Sampling)
•
언더샘플링(Under-Sampling)
예제
# model
from sklearn.datasets import make_classification
from sklearn.linear_model import LogisticRegression
from sklearn.dummy import DummyClassifier
# split dataset
from sklearn.model_selection import train_test_split
# metrics
from sklearn.metrics import roc_curve
from sklearn.metrics import roc_auc_score
from sklearn.metrics import precision_recall_curve
from sklearn.metrics import auc
# analysis
import numpy as np
import pandas as pd
# numpy float 출력옵션 변경
np.set_printoptions(formatter={'float_kind': lambda x: "{0:0.6f}".format(x)})
import logging
logging.getLogger('matplotlib.font_manager').setLevel(logging.ERROR)
Python
복사
# 코렙 한글깨짐 방지
!sudo apt-get install -y fonts-nanum
!sudo fc-cache -fv
!rm ~/.cache/matplotlib -rf
# 데이터 시각화에 사용할 라이브러리
import matplotlib.pyplot as plt
import matplotlib as mpl
import seaborn as sns
# 브라우저에서 바로 그려지도록
%matplotlib inline
# 그래프에 retina display 적용
%config InlineBackend.figure_format = 'retina'
# Colab 의 한글 폰트 설정
plt.rc('font', family='NanumBarunGothic')
# 유니코드에서 음수 부호설정
mpl.rc('axes', unicode_minus=False)
Python
복사
# plot no skill and model roc curves
def plot_roc_curve(test_y, naive_probs, model_probs,clf_name):
# plot naive skill roc curve
fpr, tpr, _ = roc_curve(test_y, naive_probs)
plt.plot(fpr, tpr, linestyle='--', label='No Skill')
# plot model roc curve
fpr, tpr, _ = roc_curve(test_y, model_probs)
plt.plot(fpr, tpr, marker='.', label=clf_name)
# axis labels
plt.xlabel('False Positive Rate')
plt.ylabel('True Positive Rate')
# show the legend
plt.legend()
# show the plot
plt.show()
Python
복사
•
generate 2 class dataset
◦
99:1 비율로 불균형 데이터 생성
X, y = make_classification(n_samples=1000, n_classes=2, weights=[0.99, 0.01], random_state=1)
X.shape, y.shape, np.unique(y)
# ((1000, 20), (1000,), array([0, 1]))
Python
복사
•
split into train/test sets with same class ratio
trainX, testX, trainy, testy = train_test_split(X, y, test_size=0.5, random_state=2, stratify=y)
trainX.shape, testX.shape, trainy.shape, testy.shape
# ((500, 20), (500, 20), (500,), (500,))
Python
복사
print('Dataset: Class0=%d, Class1=%d' % (len(y[y==0]), len(y[y==1])))
print('Train: Class0=%d, Class1=%d' % (len(trainy[trainy==0]), len(trainy[trainy==1])))
print('Test: Class0=%d, Class1=%d' % (len(testy[testy==0]), len(testy[testy==1])))
# Dataset: Class0=985, Class1=15
# Train: Class0=492, Class1=8
# Test: Class0=493, Class1=7
Python
복사
ROC-AUC Curve
•
(No Skill)dummy model
model = DummyClassifier(strategy='stratified')
model.fit(trainX, trainy)
yhat = model.predict_proba(testX)
print(yhat[0:5])
naive_probs = yhat[:, 1]
# calculate roc auc
dummy_roc_auc = roc_auc_score(testy, naive_probs)
print('No Skill ROC AUC %.3f' % dummy_roc_auc)
[[1.000000 0.000000]
[1.000000 0.000000]
[1.000000 0.000000]
[1.000000 0.000000]
[1.000000 0.000000]]
No Skill ROC AUC 0.489
Python
복사
•
LogisticRegression
model = LogisticRegression(solver='lbfgs')
model.fit(trainX, trainy)
yhat = model.predict_proba(testX)
print(yhat.shape,'\n',yhat[0:5])
model_probs = yhat[:, 1]
# calculate roc auc
model_roc_auc = roc_auc_score(testy, model_probs)
print('Logistic ROC AUC %.3f' % model_roc_auc)
(500, 2)
[[0.957972 0.042028]
[0.998611 0.001389]
[0.993158 0.006842]
[0.971323 0.028677]
[0.999533 0.000467]]
Logistic ROC AUC 0.869
Python
복사
# plot roc curves
plot_roc_curve(testy, naive_probs, model_probs, clf_name='Logistic')
Python
복사
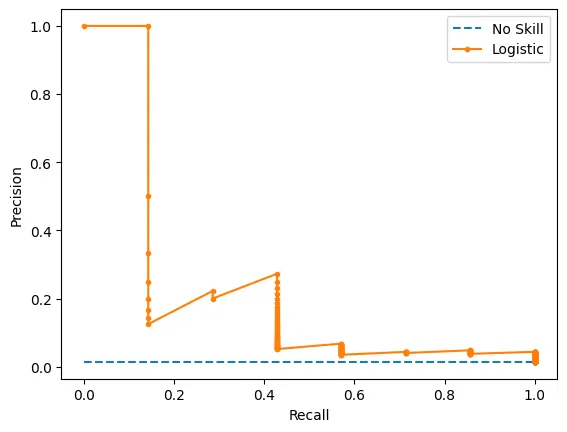
Precision-Recall Curve
def plot_pr_curve(test_y, model_probs,clf_name):
# calculate the no skill line as the proportion of the positive class
no_skill = len(test_y[test_y==1]) / len(test_y)
# plot the no skill precision-recall curve
plt.plot([0, 1], [no_skill, no_skill], linestyle='--', label='No Skill')
# plot model precision-recall curve
precision, recall, _ = precision_recall_curve(testy, model_probs)
plt.plot(recall, precision, marker='.', label=clf_name)
# axis labels
plt.xlabel('Recall')
plt.ylabel('Precision')
# show the legend
plt.legend()
# show the plot
plt.show()
Python
복사
•
(No Skill)dummy model
model = DummyClassifier(strategy='stratified')
model.fit(trainX, trainy)
yhat = model.predict_proba(testX)
print(yhat[0:5])
naive_probs = yhat[:, 1]
# calculate the precision-recall auc
precision, recall, _ = precision_recall_curve(testy, naive_probs)
dummy_auc_score = auc(recall, precision)
print('No Skill PR AUC: %.3f' % dummy_auc_score)
[[1.000000 0.000000]
[1.000000 0.000000]
[1.000000 0.000000]
[1.000000 0.000000]
[1.000000 0.000000]]
No Skill PR AUC: 0.007
Python
복사
•
LogisticRegression
model = LogisticRegression(solver='lbfgs')
model.fit(trainX, trainy)
yhat = model.predict_proba(testX)
print(yhat.shape,'\n',yhat[0:5])
model_probs = yhat[:, 1]
# calculate the precision-recall auc
precision, recall, _ = precision_recall_curve(testy, model_probs)
model_auc_score = auc(recall, precision)
print('Logistic PR AUC: %.3f' % model_auc_score)
(500, 2)
[[0.957972 0.042028]
[0.998611 0.001389]
[0.993158 0.006842]
[0.971323 0.028677]
[0.999533 0.000467]]
Logistic PR AUC: 0.228
Python
복사
# plot precision-recall curves
plot_pr_curve(testy, model_probs,clf_name='Logistic')
Python
복사
해석
ROC_AUC의 값이 전체적으로 후하다는 것을 알 수 있다. 이를 이해하기 위해서는 두 metric이 전달하고자 하는 의미를 이해하는 것이 중요하다.
•
ROC_AUC: 모든 class에 대한 종합적인 평가
•
PR_AUC: Positive class에 대한 평가(즉, minor class)
따라서 불균형 데이터를 평가할 때는, PR_AUC를 사용하는 것이 좋다.
print(f'No Skill ROC AUC: {dummy_roc_auc} / Logistic ROC AUC: {model_roc_auc}')
print('======================================================================')
print(f'No Skill PR AUC: {dummy_auc_score} / Logistic PR AUC: {model_auc_score}')
No Skill ROC AUC: 0.48884381338742394 / Logistic ROC AUC: 0.8690234714575485
======================================================================
No Skill PR AUC: 0.007 / Logistic PR AUC: 0.2277031894942569
Python
복사
Resampling (원본 데이터를 왜곡하여 조금 불필요함)
•
import
from sklearn.datasets import *
from sklearn.model_selection import train_test_split
from sklearn.metrics import recall_score
from sklearn.svm import SVC
import scipy as sp
Python
복사
•
function
def classification_result(n0, n1, title=""):
rv1 = sp.stats.multivariate_normal([-1, 0], [[1, 0], [0, 1]])
rv2 = sp.stats.multivariate_normal([+1, 0], [[1, 0], [0, 1]])
X0 = rv1.rvs(n0, random_state=0)
X1 = rv2.rvs(n1, random_state=0)
X = np.vstack([X0, X1])
y = np.hstack([np.zeros(n0), np.ones(n1)])
x1min = -4; x1max = 4
x2min = -2; x2max = 2
xx1 = np.linspace(x1min, x1max, 1000)
xx2 = np.linspace(x2min, x2max, 1000)
X1, X2 = np.meshgrid(xx1, xx2)
plt.contour(X1, X2, rv1.pdf(np.dstack([X1, X2])), levels=[0.05], linestyles="dashed")
plt.contour(X1, X2, rv2.pdf(np.dstack([X1, X2])), levels=[0.05], linestyles="dashed")
model = SVC(kernel="linear", C=1e4, random_state=0).fit(X, y)
Y = np.reshape(model.predict(np.array([X1.ravel(), X2.ravel()]).T), X1.shape)
plt.scatter(X[y == 0, 0], X[y == 0, 1], marker='x', label="0 클래스")
plt.scatter(X[y == 1, 0], X[y == 1, 1], marker='o', label="1 클래스")
plt.contour(X1, X2, Y, colors='k', levels=[0.5])
y_pred = model.predict(X)
plt.xlim(-4, 4)
plt.ylim(-3, 3)
plt.xlabel("x1")
plt.ylabel("x2")
plt.title(title)
return model, X, y, y_pred
Python
복사
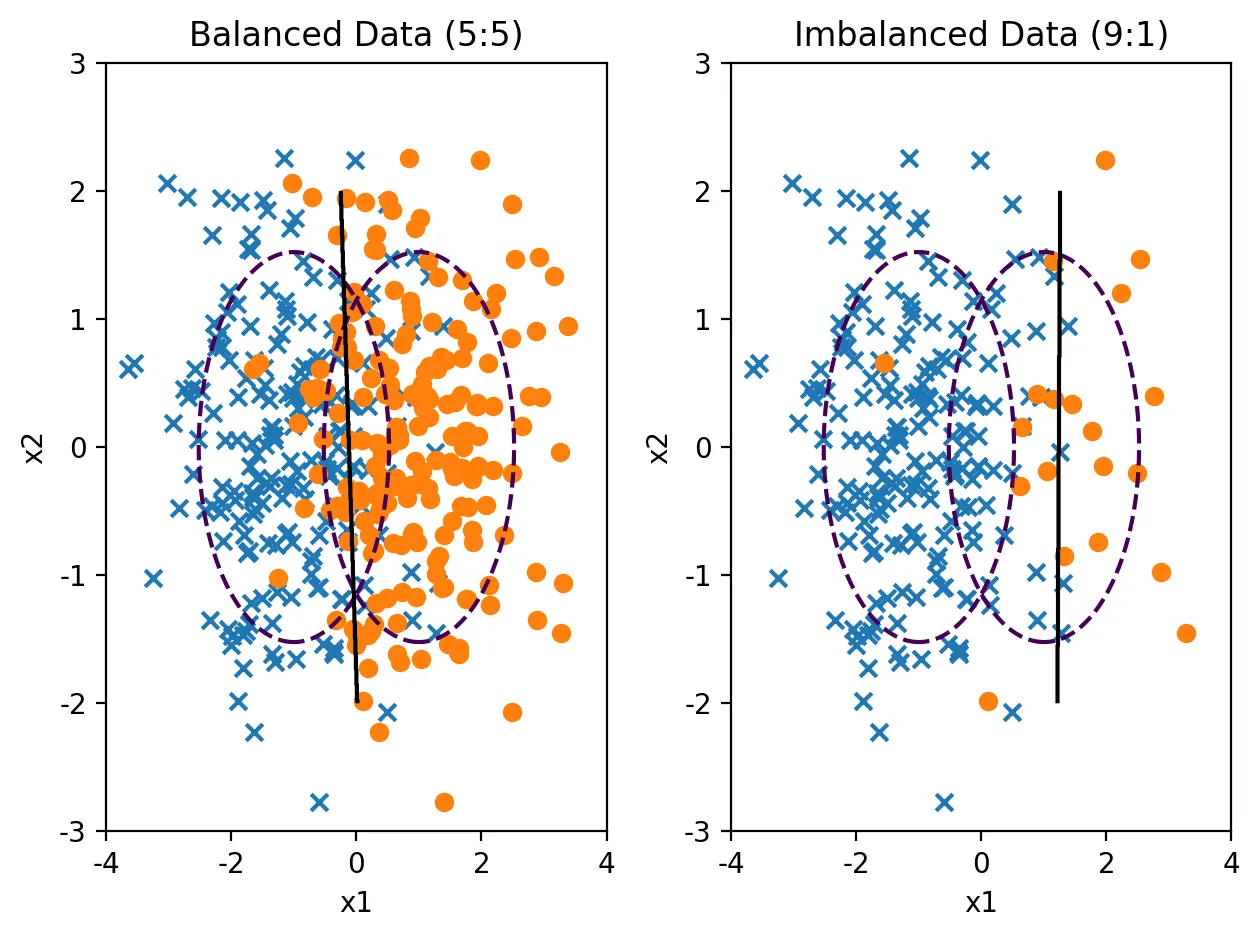
plt.subplot(121)
model1, X1, y1, y_pred1 = classification_result(200, 200, "Balanced Data (5:5)")
plt.subplot(122)
model2, X2, y2, y_pred2 = classification_result(200, 20, "Imbalanced Data (9:1)")
plt.tight_layout()
plt.show();
Python
복사
아래 결과로 알 수 있듯이,
◦
불균형 데이터인 경우에 accuracy가 더 높은 것을 알 수 있다.
◦
recall > f1-score > precision > accuracy
from sklearn.metrics import classification_report, confusion_matrix
print(classification_report(y1, y_pred1))
print('==============================================================')
print(classification_report(y2, y_pred2))
precision recall f1-score support
0.0 0.86 0.83 0.84 200
1.0 0.84 0.86 0.85 200
accuracy 0.85 400
macro avg 0.85 0.85 0.85 400
weighted avg 0.85 0.85 0.85 400
==============================================================
precision recall f1-score support
0.0 0.96 0.98 0.97 200
1.0 0.75 0.60 0.67 20
accuracy 0.95 220
macro avg 0.86 0.79 0.82 220
weighted avg 0.94 0.95 0.94 220
Python
복사
언더 샘플링(Under-Sampling)
RandomUnderSampler
•
무작위로 데이터를 없애는 단순 샘플링
오버샘플링(Over-Sampling)
RandomOverSampler
•
Random Over Sampling은 소수 클래스의 데이터를 반복해서 넣는 것(replacement)이다. 가중치를 증가시키는 것과 비슷하다.

