목차
설명
데이터 웹 앱 어플리케이션
자동 html, css 변환 기능
설치
> python -m pip install --upgrade pip
> pip install streamlit pandas numpy matplotlib seaborn finance-datareader
# 실행 방법
> streamlit run [실행할 파일]
Shell
복사
기능
텍스트 컴포넌트
import streamlit as st
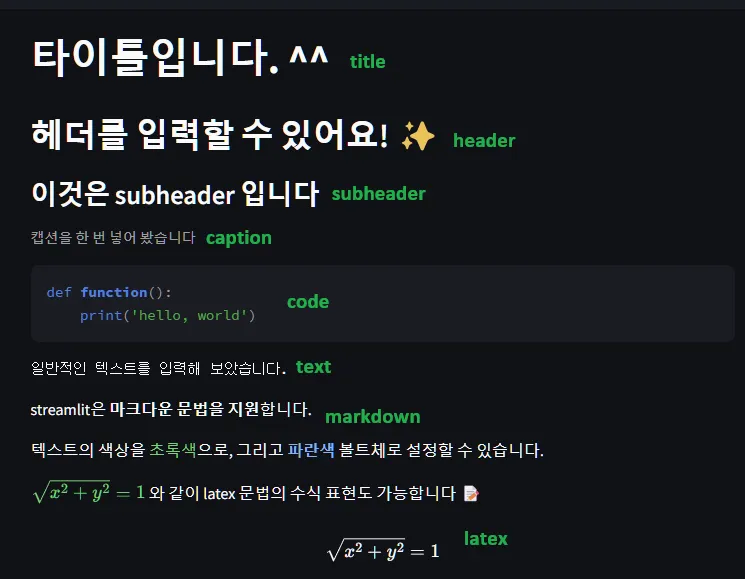
st.title("타이틀입니다. ^^")
# Header 적용
st.header("헤더를 입력할 수 있어요! :sparkles:")
# Subheader 적용
st.subheader("이것은 subheader 입니다")
# 캡션 적용
st.caption("캡션을 한 번 넣어 봤습니다")
# 코드 표시
sample_code = """
def function():
print('hello, world')
"""
st.code(sample_code, language="python")
# 일반 텍스트
st.text("일반적인 텍스트를 입력해 보았습니다.")
# 마크다운 문법 지원
st.markdown("streamlit은 **마크다운 문법을 지원**합니다.")
# 컬러코드: blue, green, orange, red, violet
st.markdown(
"텍스트의 색상을 :green[초록색]으로, 그리고 **:blue[파란색]** 볼트체로 설정할 수 있습니다."
)
st.markdown(
":green[$\sqrt{x^2+y^2}=1$] 와 같이 latex 문법의 수식 표현도 가능합니다 :pencil:"
)
# LaTex 수식 지원
# https://docs.streamlit.io/develop/api-reference/text/st.latex
st.latex(r"\sqrt{x^2+y^2}=1")
Python
복사
데이터프레임(테이블)
데이터프레임
import streamlit as st
import pandas as pd
import numpy as np
import random
# 더미데이터
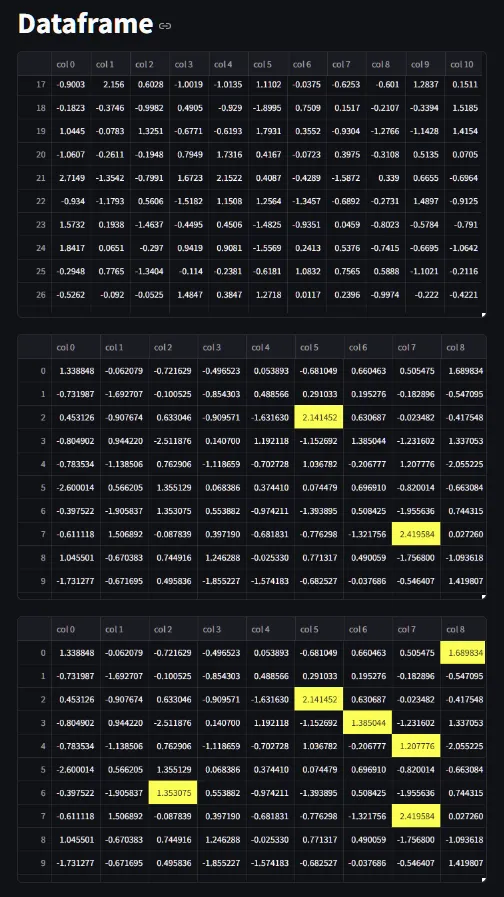
df = pd.DataFrame(np.random.randn(50, 20), columns=("col %d" % i for i in range(20)))
# np.random.randn(50, 20) : 50개의 행x20개의 열
st.title("Dataframe")
st.dataframe(df) # st.write(df)와 동일, 기본 테이블
st.dataframe(df.style.highlight_max(axis=0)) # 열별로 최대값을 강조
st.dataframe(df.style.highlight_max(axis=1)) # 행별로 최대값을 강조
# 더미데이터
df = pd.DataFrame(
{
"name": ["Roadmap", "Extras", "Issues"],
"url": [
"https://roadmap.streamlit.app",
"https://extras.streamlit.app",
"https://issues.streamlit.app",
],
"stars": [random.randint(0, 1000) for _ in range(3)],
"views_history": [
[random.randint(0, 5000) for _ in range(30)] for _ in range(3)
],
}
)
st.dataframe(
df,
column_config={
"name": "App name",
"stars": st.column_config.NumberColumn(
"Github Stars",
help="Number of stars on GitHub",
format="%d ⭐",
), # NumberColumn : 숫자 열
"url": st.column_config.LinkColumn("App URL"), #
"views_history": st.column_config.LineChartColumn(
"Views (past 30 days)", y_min=0, y_max=5000
), #
},
hide_index=True,
)
Python
복사
테이블
import streamlit as st
import pandas as pd
import numpy as np
st.title("Table")
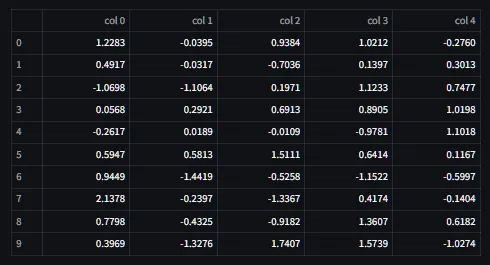
df = pd.DataFrame(np.random.randn(10, 5), columns=("col %d" % i for i in range(5)))
st.table(df) # 테이블 형태로 추가하는 방법
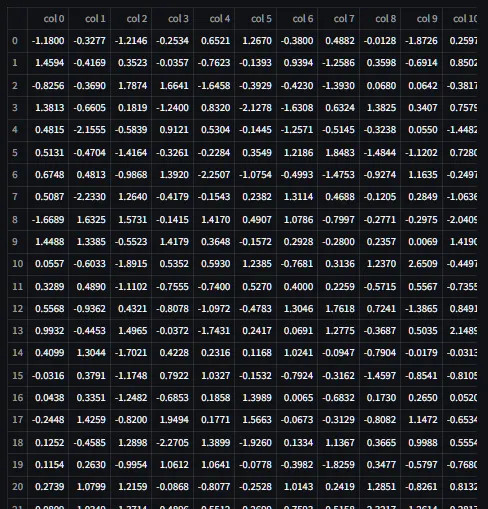
df1 = pd.DataFrame(np.random.randn(50, 20), columns=("col %d" % i for i in range(20)))
df2 = pd.DataFrame(np.random.randn(50, 20), columns=("col %d" % i for i in range(20)))
# 줄 추가
my_table = st.table(df1)
my_table.add_rows(df2)
Python
복사
차트
import streamlit as st
import pandas as pd
import numpy as np
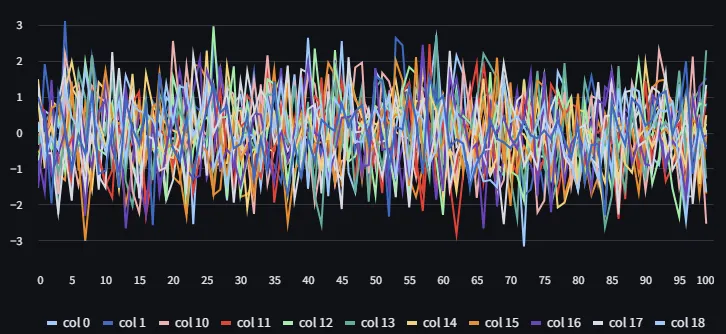
st.title('Chart')
df1 = pd.DataFrame(np.random.randn(50, 20), columns=("col %d" % i for i in range(20)))
df2 = pd.DataFrame(np.random.randn(50, 20), columns=("col %d" % i for i in range(20)))
my_chart = st.line_chart(df1)
my_chart.add_rows(df2)
Python
복사
데이터 에디터
import streamlit as st
import pandas as pd
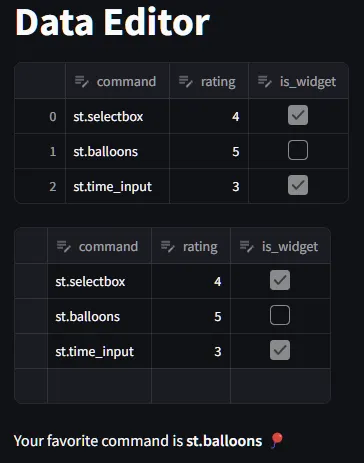
st.title('Data Editor')
df = pd.DataFrame(
[
{"command": "st.selectbox", "rating": 4, "is_widget": True},
{"command": "st.balloons", "rating": 5, "is_widget": False},
{"command": "st.time_input", "rating": 3, "is_widget": True},
]
)
edited_df = st.data_editor(df)
st.data_editor(df, num_rows="dynamic") # 행 추가 가능, 전체 체크박스 기능 추가
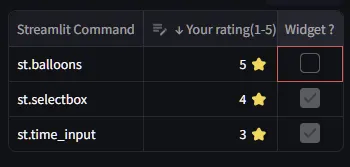
# 커스텀
edited_df = st.data_editor(
df,
column_config={
"command": "Streamlit Command",
"rating": st.column_config.NumberColumn( # 최대, 최소값 지정
"Your rating(1-5)",
help="How much do you like this command (1-5)?",
min_value=1,
max_value=5,
step=1,
format="%d ⭐",
),
"is_widget": "Widget ?",
},
disabled=["command", "is_widget"], # 비활성화 열
hide_index=True,
)
# rating에 따라서 favorite_command 값 변화
favorite_command = edited_df.loc[edited_df["rating"].idxmax()]["command"]
st.markdown(f"Your favorite command is **{favorite_command}** 🎈")
Python
복사
매트릭스, Json
import streamlit as st
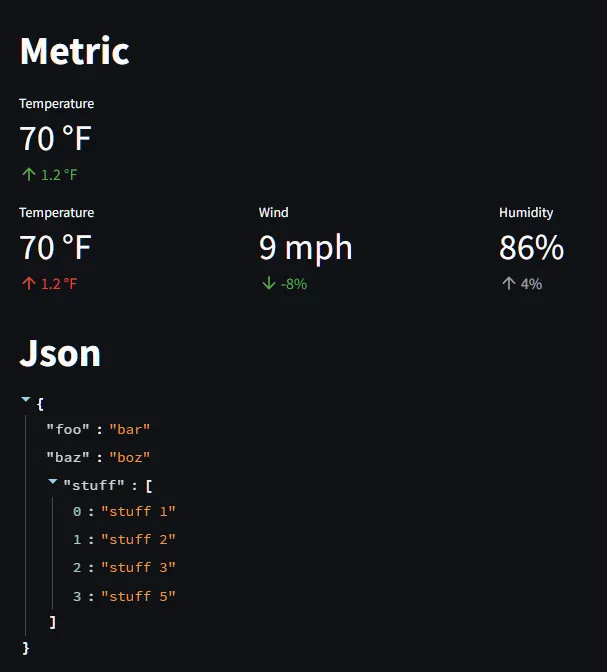
st.title("Metric")
st.metric(label="Temperature", value="70 °F", delta="1.2 °F")
# grid
# st.columns(행 개수)
# 행.metric(열 요소)
col1, col2, col3 = st.columns(3)
col1.metric(label="Temperature", value="70 °F", delta="1.2 °F", delta_color="inverse")
col2.metric(label="Wind", value="9 mph", delta="-8%", delta_color="inverse")
col3.metric(label="Humidity", value="86%", delta="4%", delta_color="off")
st.title("Json")
st.json(
{
"foo": "bar",
"baz": "boz",
"stuff": [
"stuff 1",
"stuff 2",
"stuff 3",
"stuff 5",
],
}
)
Python
복사
위젯
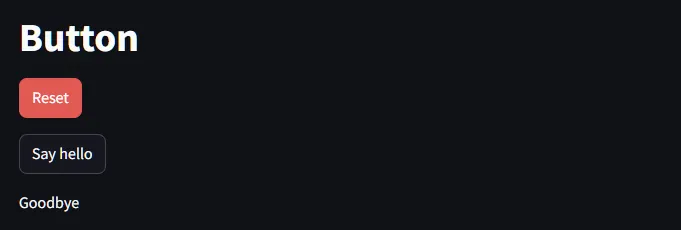
기본 버튼
import streamlit as st
st.title("Button")
st.button("Reset", type="primary")
if st.button("Say hello"):
st.write("Why hello there")
else:
st.write("Goodbye")
Python
복사
다운로드 버튼
import streamlit as st
import pandas as pd
# 파일 다운로드 버튼
# 샘플 데이터 생성
dataframe = pd.DataFrame({
'first column': [1, 2, 3, 4],
'second column': [10, 20, 30, 40],
})
@st.cache_data
def convert_df(df):
# IMPORTANT: Cache the conversion to prevent computation on every rerun
return df.to_csv().encode("utf-8")
csv = convert_df(dataframe)
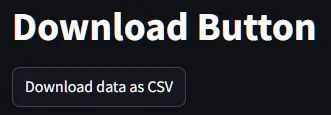
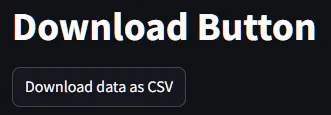
st.title('Download Button')
# 다운로드 버튼 연결
st.download_button(
label='Download data as CSV',
data=csv,
file_name='sample.csv',
mime='text/csv'
)
Python
복사
form 승인 버튼
import streamlit as st
import pandas as pd
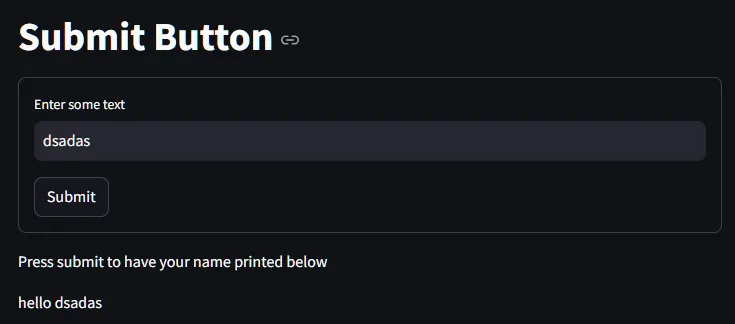
st.title("Submit Button")
# Using the "with" syntax
with st.form(key="my_form"):
text_input = st.text_input(label="Enter some text")
submit_button = st.form_submit_button(label="Submit")
st.write("Press submit to have your name printed below")
if submit_button:
st.write(f"hello {text_input}")
Python
복사
링크 버튼
import streamlit as st
import pandas as pd
st.title("Link Button")
st.link_button("Go to gallery", "https://streamlit.io/gallery")
Python
복사
사이드바, 멀티페이지 링크
import streamlit as st
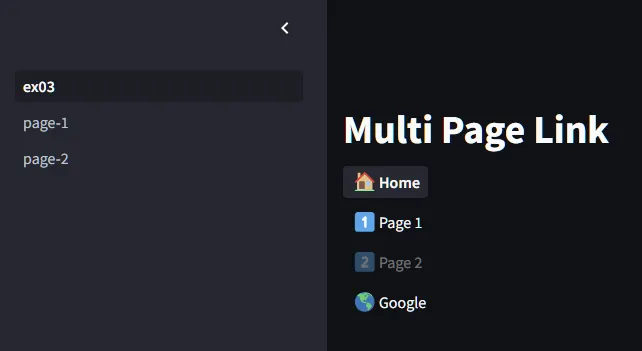
st.title("Multi Page Link")
st.page_link("./ex03.py", label="Home", icon="🏠")
st.page_link("./pages/page-1.py", label="Page 1", icon="1️⃣")
st.page_link("./pages/page-2.py", label="Page 2", icon="2️⃣", disabled=True) # 비활성화
st.page_link("http://www.google.com", label="Google", icon="🌎")
Python
복사
체크박스 & 토글 버튼
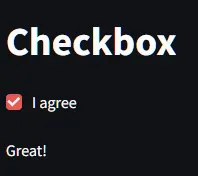
import streamlit as st
st.title("Checkbox")
agree = st.checkbox("I agree")
if agree:
st.write("Great!")
st.title("Toggle")
on = st.toggle("Activate feature")
if on:
st.write("Feature activated!")
Python
복사
라디오 버튼
import streamlit as st
st.title("Radio")
genre = st.radio(
"What's your favorite movie genre",
[":rainbow[Comedy]", "***Drama***", "Documentary :movie_camera:"],
captions=["Laugh out loud.", "Get the popcorn.", "Never stop learning."],
)
if genre == ":rainbow[Comedy]":
st.write("You selected comedy.")
else:
st.write("You didn't select comedy.")
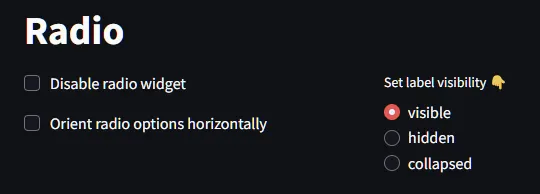
st.title("Radio")
if "visibility" not in st.session_state:
st.session_state.visibility = "visible"
st.session_state.disabled = False
st.session_state.horizontal = False
col1, col2 = st.columns(2)
with col1:
st.checkbox("Disable radio widget", key="disabled")
st.checkbox("Orient radio options horizontally", key="horizontal")
with col2:
st.radio(
"Set label visibility 👇",
["visible", "hidden", "collapsed"],
key="visibility",
label_visibility=st.session_state.visibility,
disabled=st.session_state.disabled,
horizontal=st.session_state.horizontal,
)
Python
복사
Select Box
import streamlit as st
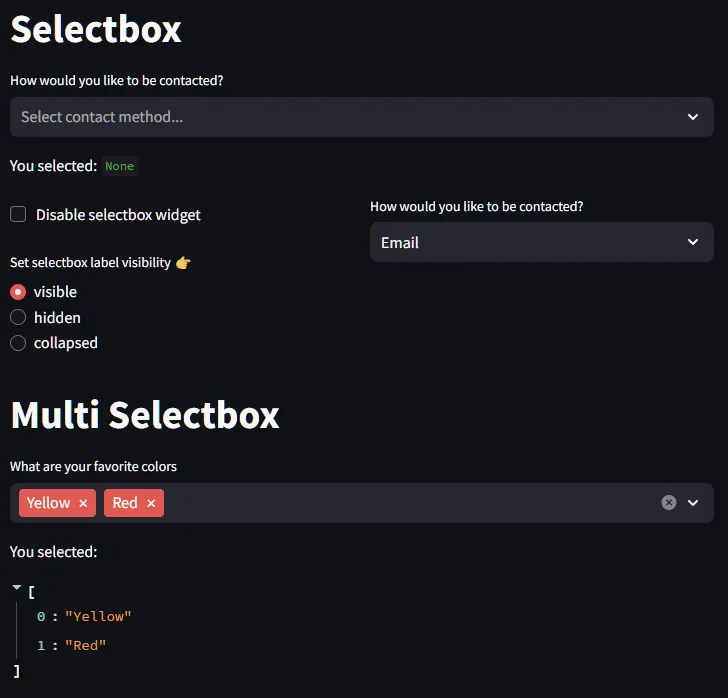
st.title("Selectbox")
option = st.selectbox(
"How would you like to be contacted?",
("Email", "Home phone", "Mobile phone"),
index=None,
placeholder="Select contact method...",
)
st.write("You selected:", option)
### 투명 불투명 컨트롤
if "visibility" not in st.session_state:
st.session_state.visibility = "visible"
st.session_state.disabled = False
col1, col2 = st.columns(2)
with col1:
st.checkbox("Disable selectbox widget", key="disabled") # 비활성화
st.radio(
"Set selectbox label visibility 👉",
key="visibility",
options=["visible", "hidden", "collapsed"], # 투명 불투명 옵션
)
with col2:
option = st.selectbox(
"How would you like to be contacted?",
("Email", "Home phone", "Mobile phone"),
label_visibility=st.session_state.visibility,
disabled=st.session_state.disabled,
)
### 멀티 Select Box
st.title("Multi Selectbox")
options = st.multiselect(
"What are your favorite colors",
["Green", "Yellow", "Red", "Blue"],
["Yellow", "Red"],
)
st.write("You selected:", options)
Python
복사
숫자 입력칸
import streamlit as st
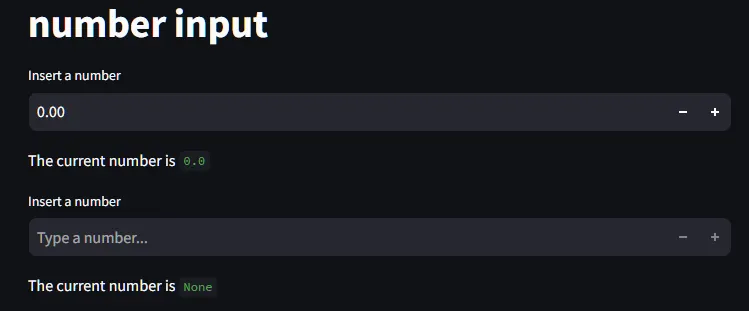
st.title("number input")
number1 = st.number_input("Insert a number")
st.write("The current number is ", number1)
# placeholder, value=초기값 설정
number2 = st.number_input("Insert a number", value=None, placeholder="Type a number...")
st.write("The current number is ", number2)
Python
복사
슬라이더
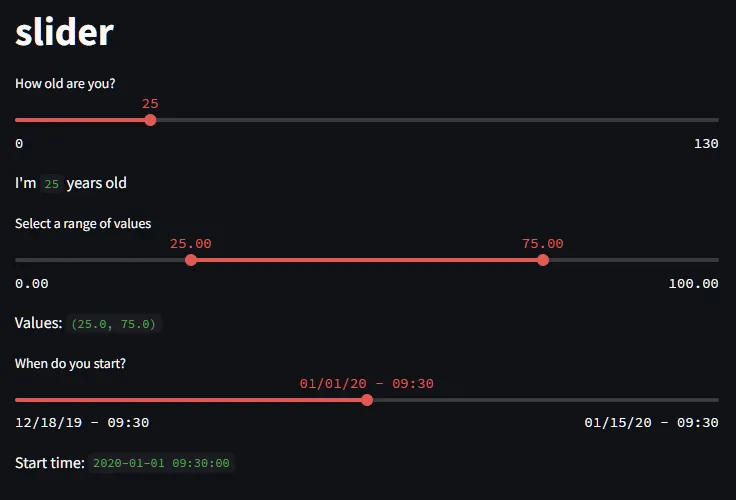
import streamlit as st
from datetime import datetime
st.title("slider")
# 기본
age = st.slider("How old are you?", 0, 130, 25) # min, max, 초기값
st.write("I'm ", age, "years old")
# 범위 슬라이더
values = st.slider("Select a range of values", 0.0, 100.0, (25.0, 75.0)) # min, max, 초기값
st.write("Values:", values)
# 날짜 슬라이더
start_time = st.slider(
"When do you start?", value=datetime(2020, 1, 1, 9, 30), format="MM/DD/YY - hh:mm"
)
st.write("Start time:", start_time)
Python
복사
날짜간 입력란
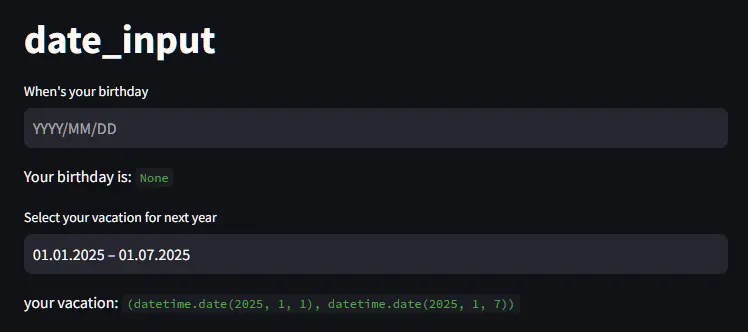
import datetime
import streamlit as st
st.title("date_input")
d1 = st.date_input("When's your birthday", value=None)
st.write("Your birthday is:", d1)
## 날짜 입력
today = datetime.datetime.now()
next_year = today.year + 1
jan_1 = datetime.date(next_year, 1, 1)
dec_31 = datetime.date(next_year, 12, 31)
d2 = st.date_input(
"Select your vacation for next year",
(jan_1, datetime.date(next_year, 1, 7)),
jan_1,
dec_31,
format="MM.DD.YYYY",
)
st.write("your vacation:", d2)
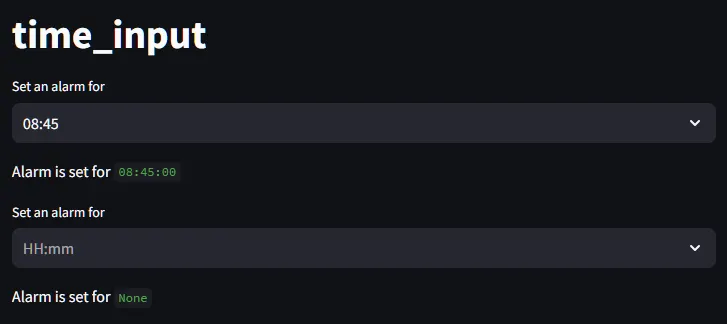
## 시간 입력
st.title('time_input')
t1 = st.time_input("Set an alarm for", datetime.time(8, 45))
st.write("Alarm is set for", t1)
t2 = st.time_input("Set an alarm for", value=None)
st.write("Alarm is set for", t2)
Python
복사
텍스트 입력란
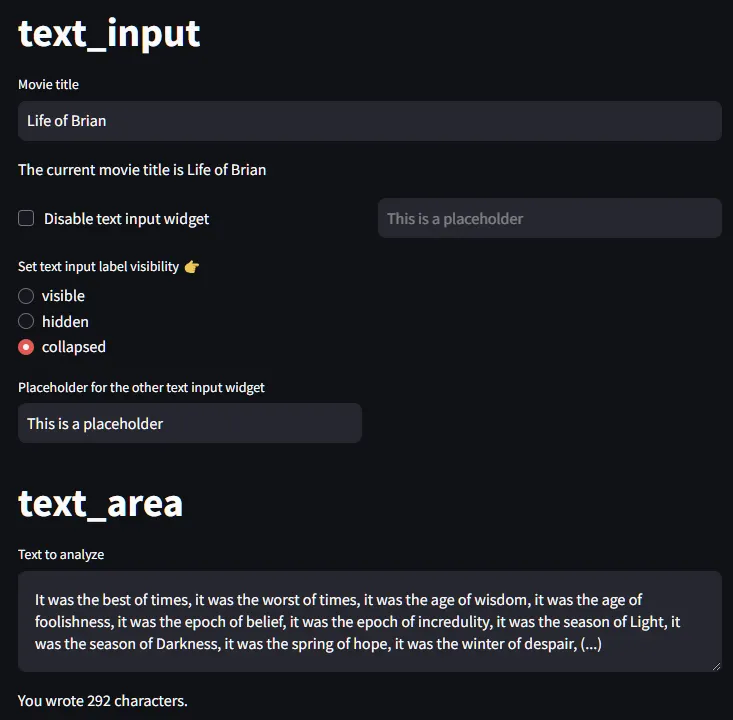
import streamlit as st
st.title("text_input")
### 텍스트 입력
title = st.text_input("Movie title", "Life of Brian")
st.write("The current movie title is", title)
if "visibility" not in st.session_state:
st.session_state.visibility = "visible"
st.session_state.disabled = False
col1, col2 = st.columns(2)
with col1:
st.checkbox("Disable text input widget", key="disabled")
st.radio(
"Set text input label visibility 👉",
key="visibility",
options=["visible", "hidden", "collapsed"],
)
st.text_input(
"Placeholder for the other text input widget",
"This is a placeholder",
key="placeholder",
)
with col2:
text_input = st.text_input(
"Enter some text 👇",
label_visibility=st.session_state.visibility,
disabled=st.session_state.disabled,
placeholder=st.session_state.placeholder,
)
if text_input:
st.write("You entered: ", text_input)
### 텍스트 영역
st.title("text_area")
txt = st.text_area(
"Text to analyze",
"It was the best of times, it was the worst of times, it was the age of "
"wisdom, it was the age of foolishness, it was the epoch of belief, it "
"was the epoch of incredulity, it was the season of Light, it was the "
"season of Darkness, it was the spring of hope, it was the winter of "
"despair, (...)",
)
st.write(f"You wrote {len(txt)} characters.")
Python
복사
챗봇
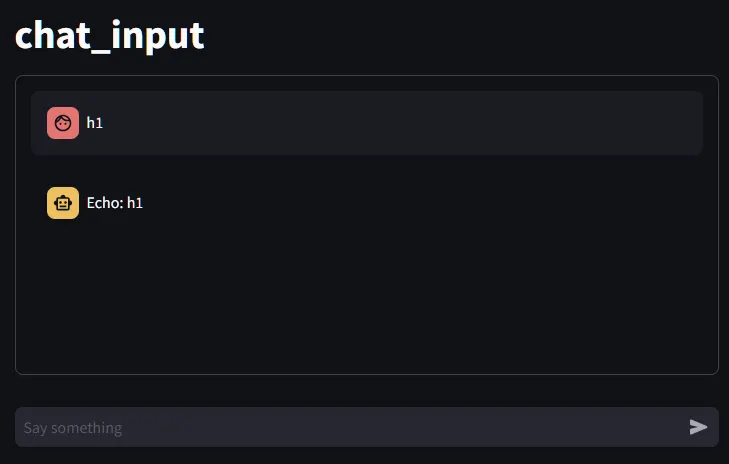
import streamlit as st
st.title("chat_input")
messages = st.container(height=300)
if prompt := st.chat_input("Say something"):
messages.chat_message("user").write(prompt)
messages.chat_message("assistant").write(f"Echo: {prompt}")
Python
복사
파일 업/다운로드
업로드
import pandas as pd
import streamlit as st
st.title("Upload file")
uploaded_files = st.file_uploader(
"Choose a CSV or excel file",
accept_multiple_files=True,
type=["csv", "xls", "xlsx"],
)
for file in uploaded_files:
st.write("filename:", file.name)
if file is not None:
ext = file.name.split(".")[-1]
if ext == "csv":
# 파일 읽기
df = pd.read_csv(file)
# 출력
st.dataframe(df)
elif "xls" in ext:
# 엑셀 로드
df = pd.read_excel(file, engine="openpyxl")
# 출력
st.dataframe(df)
Python
복사
다운로드
import pandas as pd
import streamlit as st
# 파일 다운로드 버튼
# 샘플 데이터 생성
dataframe = pd.DataFrame(
{
"first column": [1, 2, 3, 4],
"second column": [10, 20, 30, 40],
}
)
@st.cache_data
def convert_df(df):
# IMPORTANT: Cache the conversion to prevent computation on every rerun
return df.to_csv().encode("utf-8")
st.title("Download file")
st.dataframe(dataframe)
# 다운로드 버튼 연결
st.download_button(
label="Download data as CSV",
data=convert_df(dataframe),
file_name="sample.csv",
mime="text/csv",
)
Python
복사
그래프
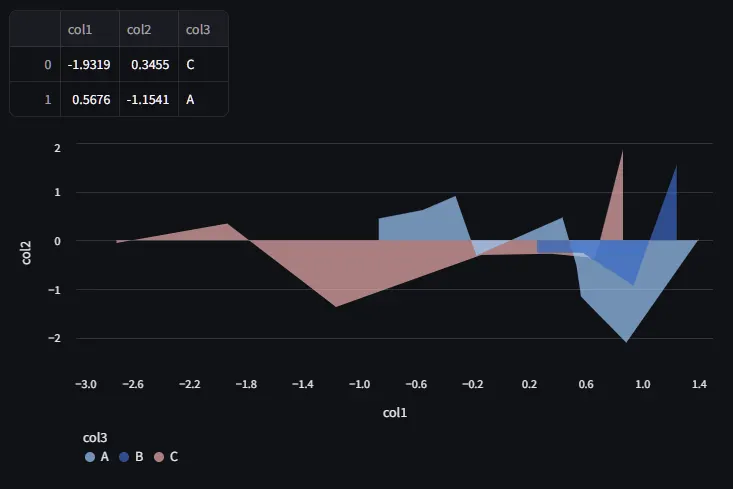
area_chart
import numpy as np
import pandas as pd
import streamlit as st
## 기본
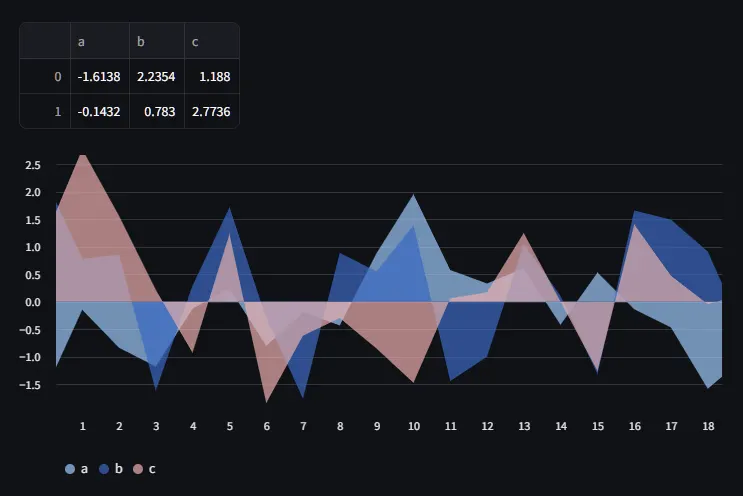
chart_data = pd.DataFrame(np.random.randn(20, 3), columns=["a", "b", "c"])
st.dataframe(chart_data[:2])
st.area_chart(chart_data)
## x,y값 지정
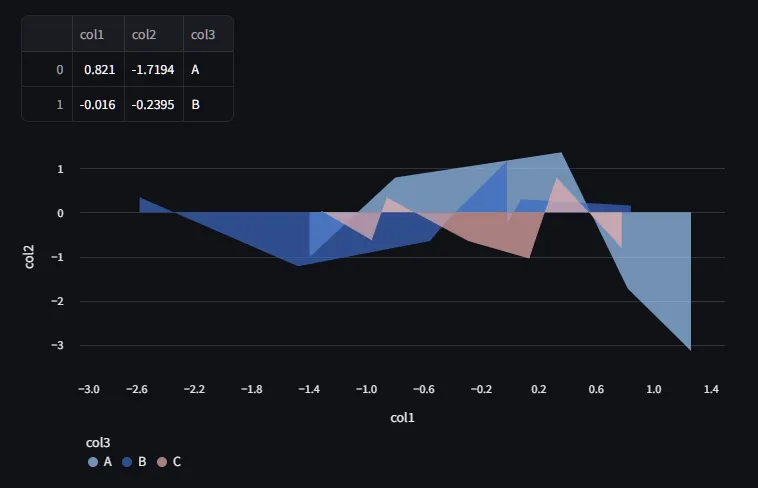
chart_data = pd.DataFrame(
{
"col1": np.random.randn(20),
"col2": np.random.randn(20),
"col3": np.random.choice(["A", "B", "C"], 20),
}
)
st.dataframe(chart_data[:2])
# x값과 y값 지정
st.area_chart(chart_data, x="col1", y="col2", color="col3")
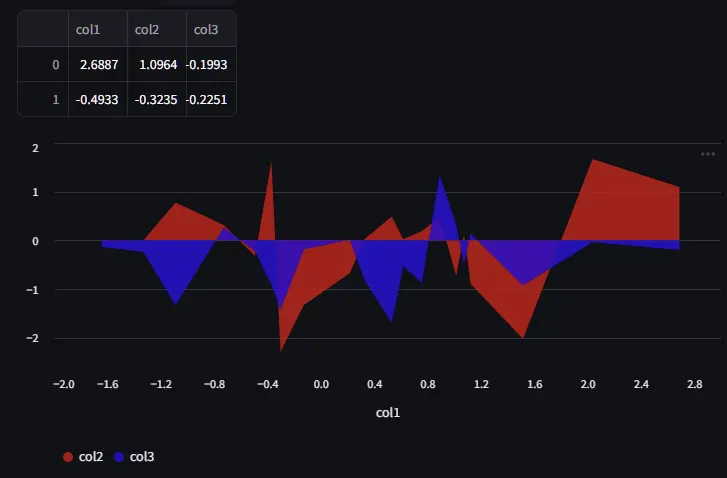
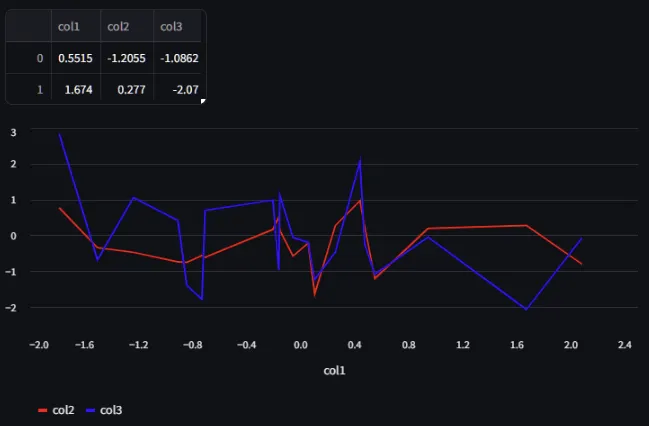
## 색상 지정
chart_data = pd.DataFrame(np.random.randn(20, 3), column
s=["col1", "col2", "col3"])
st.dataframe(chart_data[:2])
st.area_chart(
chart_data, x="col1", y=["col2", "col3"], color=["#FF0000", "#0000FF"] # Optional
)
Python
복사
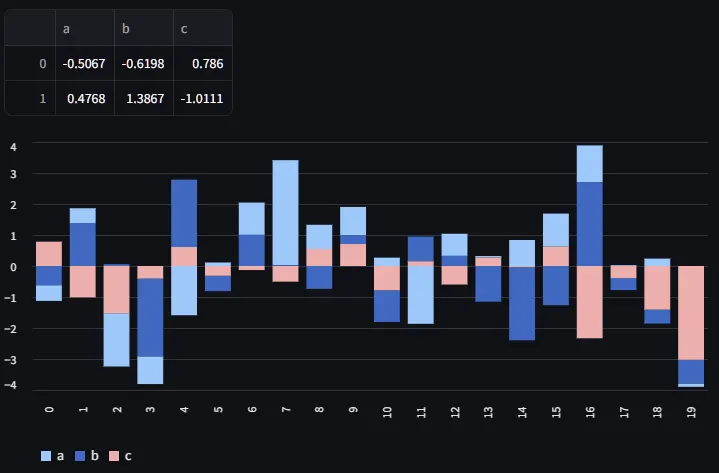
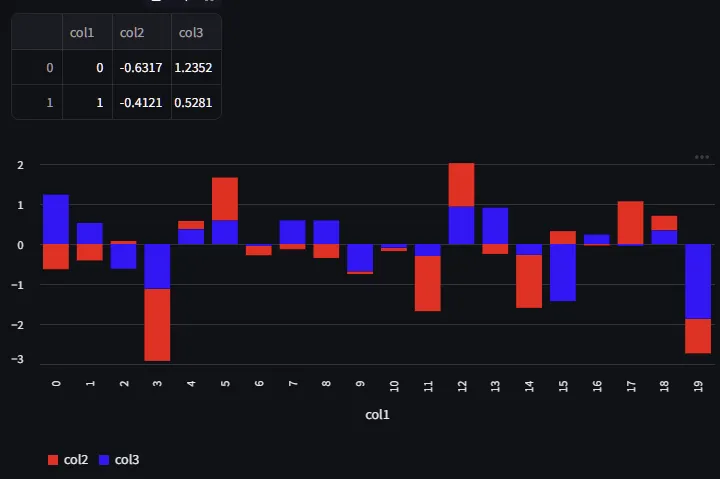
bar_chart
import numpy as np
import pandas as pd
import streamlit as st
## 기본
chart_data = pd.DataFrame(np.random.randn(20, 3), columns=["a", "b", "c"])
st.dataframe(chart_data[:2])
st.bar_chart(chart_data)
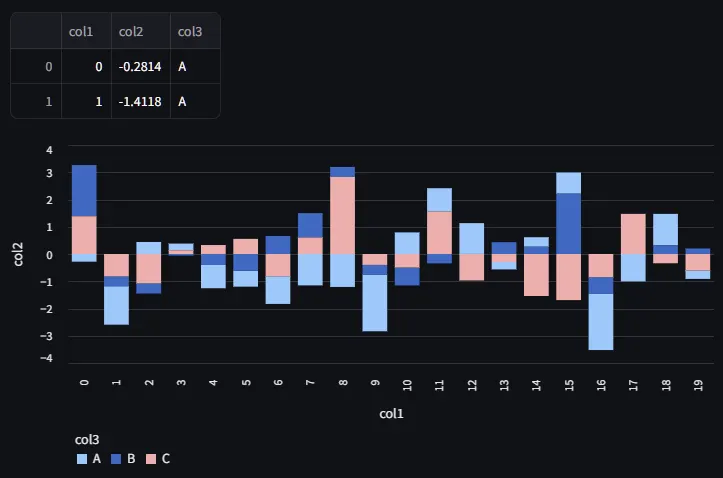
## x,y값 지정
chart_data = pd.DataFrame(
{
"col1": list(range(20)) * 3,
"col2": np.random.randn(60),
"col3": ["A"] * 20 + ["B"] * 20 + ["C"] * 20,
}
)
st.dataframe(chart_data[:2])
st.bar_chart(chart_data, x="col1", y="col2", color="col3")
## 색상 지정
chart_data = pd.DataFrame(
{"col1": list(range(20)), "col2": np.random.randn(20), "col3": np.random.randn(20)}
)
st.dataframe(chart_data[:2])
st.bar_chart(
chart_data, x="col1", y=["col2", "col3"], color=["#FF0000", "#0000FF"] # Optional
)
Python
복사
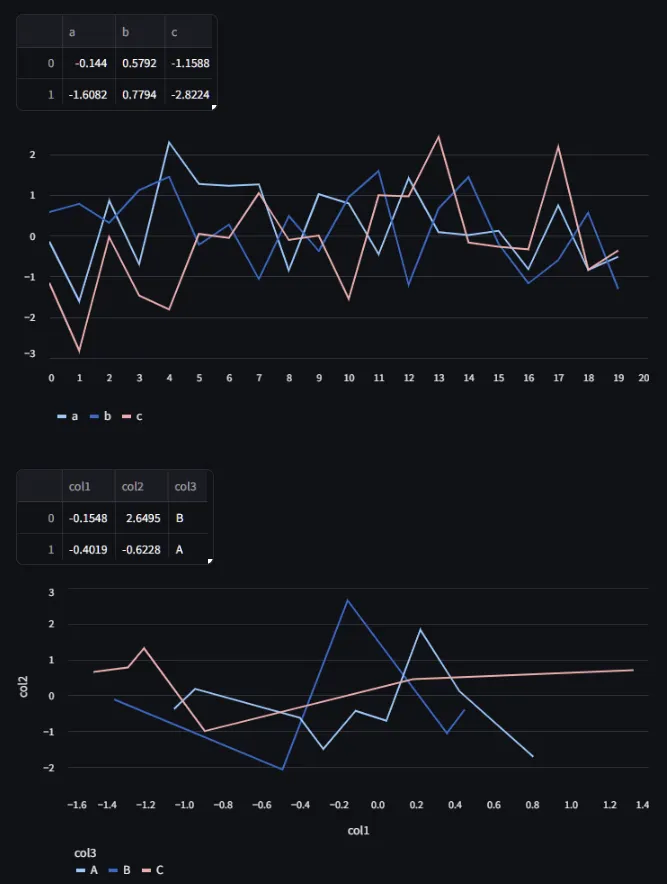
line_chart
import numpy as np
import pandas as pd
import streamlit as st
## 기본
chart_data = pd.DataFrame(np.random.randn(20, 3), columns=["a", "b", "c"])
st.dataframe(chart_data[:2])
st.line_chart(chart_data)
## x,y값 지정
chart_data = pd.DataFrame(
{
"col1": np.random.randn(20),
"col2": np.random.randn(20),
"col3": np.random.choice(["A", "B", "C"], 20),
}
)
st.dataframe(chart_data[:2])
st.line_chart(chart_data, x="col1", y="col2", color="col3")
## 색상 지정
chart_data = pd.DataFrame(np.random.randn(20, 3), columns=["col1", "col2", "col3"])
st.dataframe(chart_data[:2])
st.line_chart(
chart_data, x="col1", y=["col2", "col3"], color=["#FF0000", "#0000FF"] # Optional
)
Python
복사
Layout & container
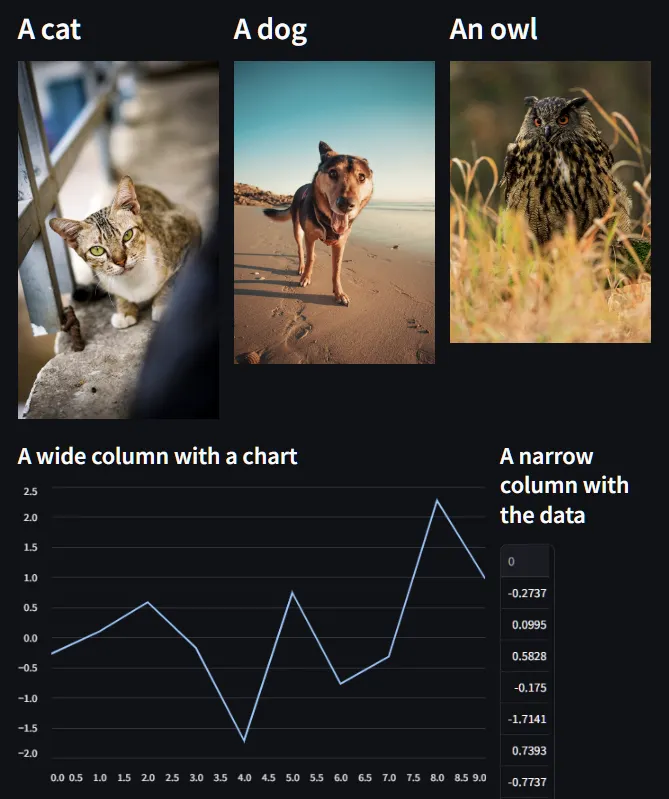
cols, rows
import streamlit as st
import numpy as np
col1, col2, col3 = st.columns(3)
# grid
# st.columns(행 개수)
# 행.metric(열 요소)
# or
# with col1,2,3 (열)
with col1:
st.header("A cat")
st.image("https://static.streamlit.io/examples/cat.jpg")
with col2:
st.header("A dog")
st.image("https://static.streamlit.io/examples/dog.jpg")
with col3:
st.header("An owl")
st.image("https://static.streamlit.io/examples/owl.jpg")
col1, col2 = st.columns([3, 1])
data = np.random.randn(10, 1)
col1.subheader("A wide column with a chart")
col1.line_chart(data)
col2.subheader("A narrow column with the data")
col2.write(data)
Python
복사
Container
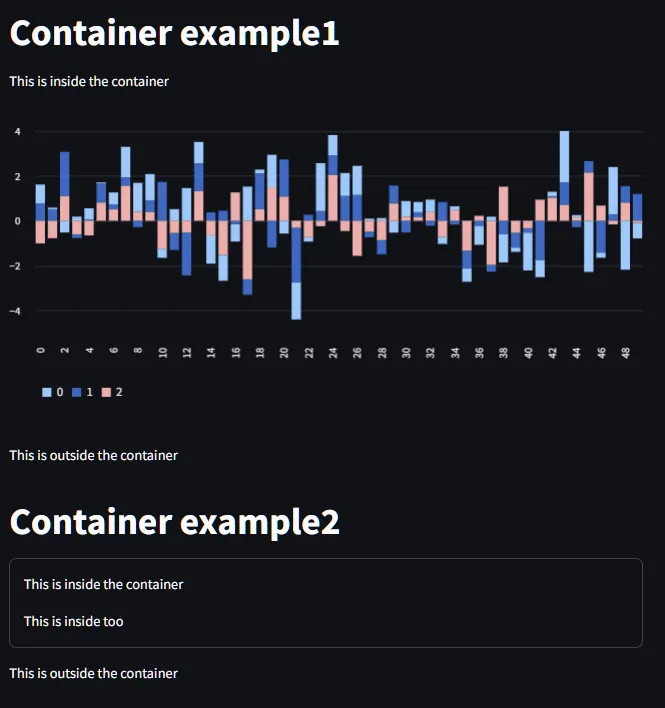
import numpy as np
import streamlit as st
st.title("Container example1")
with st.container():
st.write("This is inside the container")
# You can call any Streamlit command, including custom components:
st.bar_chart(np.random.randn(50, 3))
st.write("This is outside the container")
st.title("Container example2")
container = st.container(border=True)
container.write("This is inside the container")
st.write("This is outside the container")
# Now insert some more in the container
container.write("This is inside too")
Python
복사
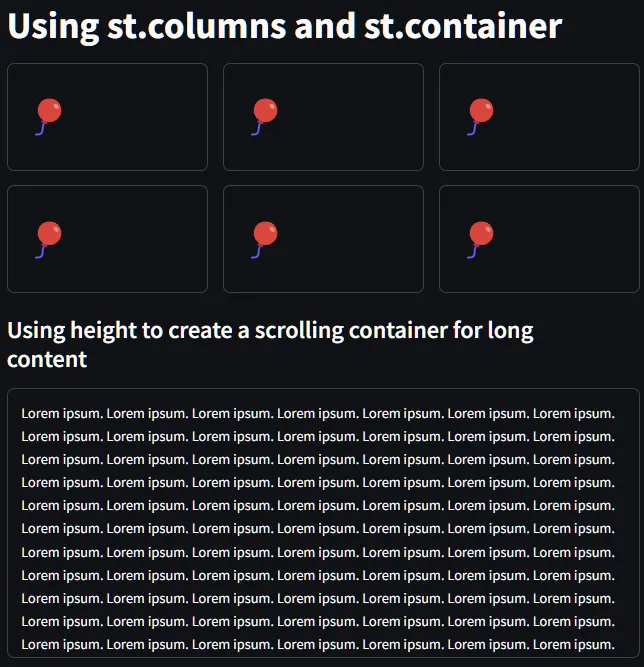
import streamlit as st
st.title("Using st.columns and st.container")
row1 = st.columns(3)
row2 = st.columns(3)
for col in row1 + row2:
tile = col.container(height=120)
tile.title(":balloon:")
st.subheader("Using height to create a scrolling container for long content")
long_text = "Lorem ipsum. " * 1000
with st.container(height=300):
st.markdown(long_text)
Python
복사
dialog
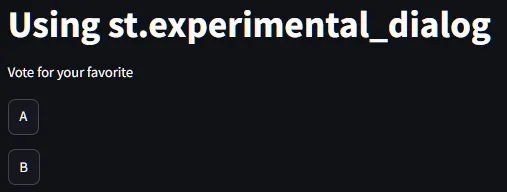
import streamlit as st
st.title("Using st.experimental_dialog")
@st.experimental_dialog("Cast your vote")
def vote(item):
st.write(f"Why is {item} your favorite?")
reason = st.text_input("Because...")
if st.button("Submit"):
st.session_state.vote = {"item": item, "reason": reason}
st.rerun()
if "vote" not in st.session_state:
st.write("Vote for your favorite")
if st.button("A"):
vote("A")
if st.button("B"):
vote("B")
else:
f"You voted for {st.session_state.vote['item']} because {st.session_state.vote['reason']}"
Python
복사
expander
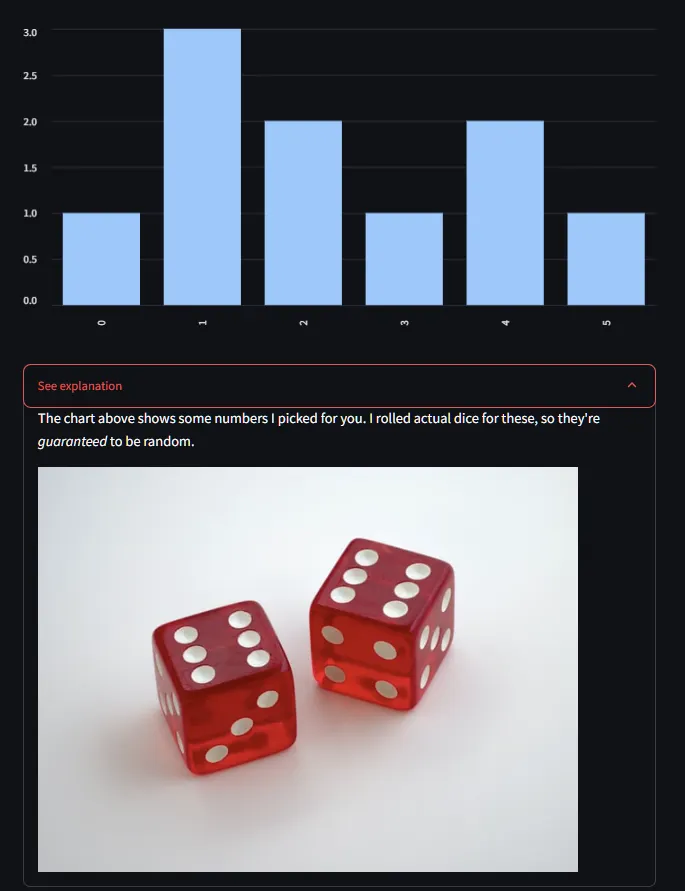
import streamlit as st
st.bar_chart({"data": [1, 3, 2, 1, 2, 1]})
with st.expander("See explanation"):
st.write(
"""
The chart above shows some numbers I picked for you.
I rolled actual dice for these, so they're *guaranteed* to
be random.
"""
)
st.image("https://static.streamlit.io/examples/dice.jpg")
Python
복사
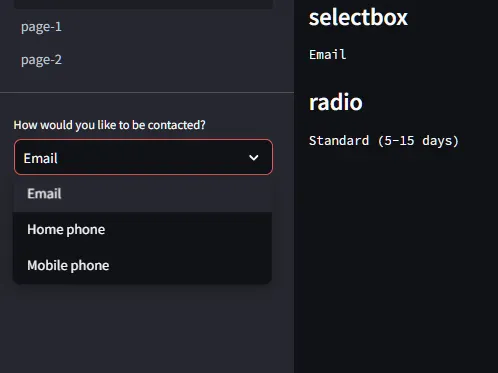
sidebar
import streamlit as st
# Using object notation
add_selectbox = st.sidebar.selectbox(
"How would you like to be contacted?", ("Email", "Home phone", "Mobile phone")
)
# Using "with" notation
with st.sidebar:
add_radio = st.radio(
"Choose a shipping method", ("Standard (5-15 days)", "Express (2-5 days)")
)
if add_selectbox:
st.subheader("selectbox")
st.text(add_selectbox)
if add_radio:
st.subheader("radio")
st.text(add_radio)
Python
복사
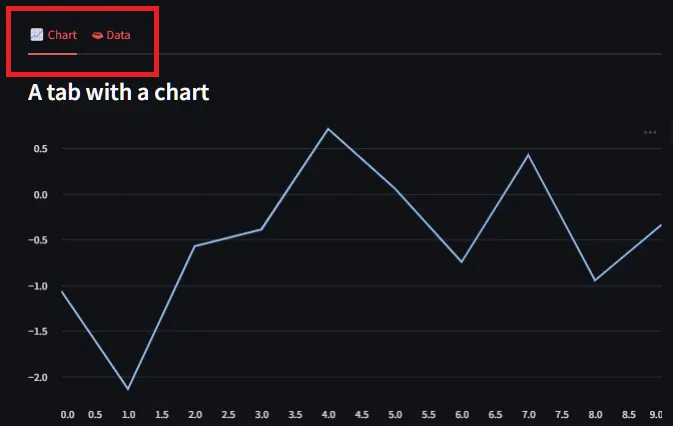
tab
import numpy as np
import streamlit as st
tab1, tab2 = st.tabs(["📈 Chart", "🗃 Data"])
data = np.random.randn(10, 1)
tab1.subheader("A tab with a chart")
tab1.line_chart(data)
tab2.subheader("A tab with the data")
tab2.write(data)
Python
복사
mysql과 연결
1. 사전 모듈 설치
> python -m pip install --upgrade pip
> pip install SQLAlchemy mysqlclient
Python
복사
2. MySQL 접속
•
.streamlit/secrets.toml 파일 생성
TOML (Tom's Obvious, Minimal Language) 파일
설정 파일 형식 == JSON이나 YAML가 비슷한 역할
[connections.mydb] # 커넥션 이름
dialect = "mysql" # 접속할 데이터베이스 종류
username = "urstory" # 접속할 데이터베이스 계정
password = "u1234" # 접속할 데이터베이스 비밀번호
host = "localhost" # 접속할 데이터베이스 주소
database = "classicmodels" # 접속할 데이터베이스 이름
Python
복사
3. 코드 작성
import streamlit as st
conn = st.connection("mydb", type="sql", autocommit=True)
df = conn.query("show databases", ttl=3600)
st.dataframe(df)
sql = """
SELECT
YEAR(o.orderDate) AS year,
MONTH(o.orderDate) AS month,
c.salesRepEmployeeNumber AS employeeNumber,
SUM(od.priceEach * od.quantityOrdered) AS totalPayments
FROM
orders o,
orderdetails od,
customers c
WHERE
o.orderNumber = od.orderNumber
AND o.customerNumber = c.customerNumber
AND YEAR(o.orderDate) = 2003
GROUP BY
YEAR(o.orderDate),
MONTH(o.orderDate),
c.salesRepEmployeeNumber
"""
df = conn.query(sql, ttl=3600)
st.dataframe(df)
Python
복사

