모델 성능 평가지표(Metric)
•
실제값과 모델에 의해 예측된 값을 비교하여 모델의 성능을 측정하는 방법
회귀 모형 성능 측정
회귀모델(Linear Regression) 학습 및 예측
from sklearn.datasets import load_diabetes
diabetes = load_diabetes()
data = diabetes.data
target = diabetes.target
data.shape , target.shape
# ((442, 10), (442,))
Python
복사
from sklearn.model_selection import train_test_split
SEED = 42
x_train, x_valid , y_train, y_valid = train_test_split(data, target, random_state=SEED)
x_train.shape, x_valid.shape , y_train.shape, y_valid.shape
# ((331, 10), (111, 10), (331,), (111,))
Python
복사
from sklearn.linear_model import LinearRegression # Regression : 회귀모델
# 모델 생성
model = LinearRegression()
# 모델 학습
model.fit(x_train,y_train)
# 모델 예측
pred = model.predict(x_valid)
Python
복사
pred.shape, y_valid.shape
# ((111,), (111,))
Python
복사
회귀 평가 지표
•
실제 값과 회귀 예측값의 차이를 기반
•
회귀 평가지표 MAE, MSE, RMSE, MSLE, RMSLE는 값이 작을수록 회귀 성능이 좋은 것
•
값이 작을수록 예측값과 실제값의 차이가 없다는 뜻
•
반면, R² 는 값이 클수록 성능이 좋다.
R2(결정계수 : Coefficient of Determination)
•
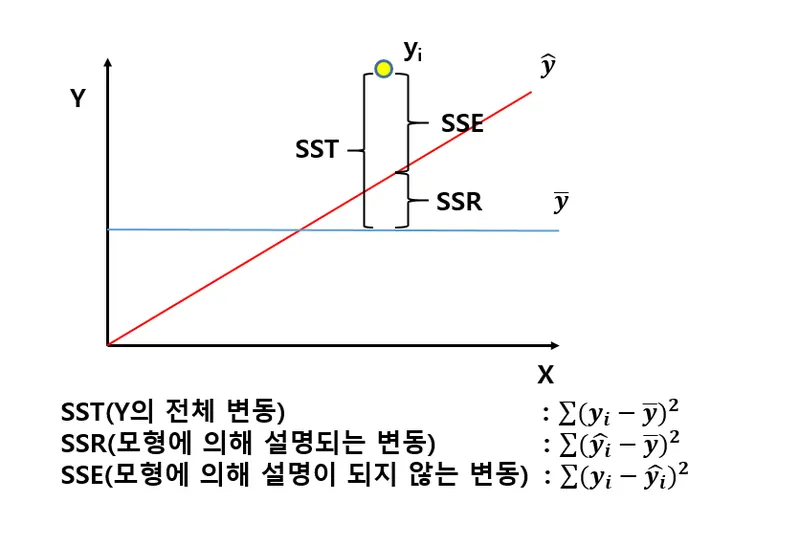
회귀식이 얼마나 정확한지를 나타내는 숫자
•
SSR (= Residual Sum of Squares): 잔차제곱합
•
SST (= Total Sum of Squares): 총 제곱합
•
SSE (= Explained Sum of Squares): 회귀제곱합
•
기호 설명
◦
= 연속되는 데이터의 자리수(인덱스)
◦
: y_valid.mean()
◦
: pred 데이터
◦
: y_valid 데이터
•
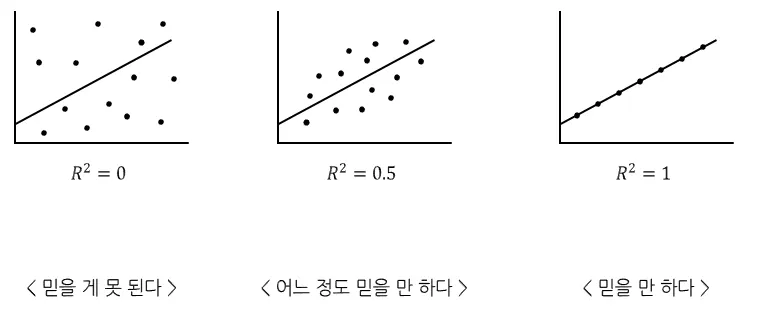
결정계수의 해석
◦
R² = 0: 회귀모델이 종속변수의 변동을 전혀 설명하지 못함을 의미
◦
R² = 1: 회귀모델이 종속변수의 변동을 완벽하게 설명함을 의미
◦
0 < R² < 1: 회귀모델이 종속변수의 변동을 부분적으로 설명함을 의미
from sklearn.metrics import r2_score
r2 = r2_score(y_valid, pred)
r2
# 0.4849058889476756
Python
복사
MSE(Mean Squared Error) = 평균 제곱 오차
•
실제값과 예측값의 차이를 제곱한뒤 평균화
•
이상치 민감
•
직관적이지 못하다.
•
손실함수로 주로 사용
from sklearn.metrics import mean_squared_error
mse = mean_squared_error(y_valid, pred)
mse
# 2848.3106508475053
Python
복사
RMSE(Root Mean Squared Error) = 평균 제곱근 오차
•
MSE에 루트
•
MSE 값은 오류의 제곱을 구하므로 실제 오류 평균보다 더 커지는 특성이 있어 MSE에 루트를 씌운 RMSE 값을 쓰는 것
•
이상치 민감
import numpy as np
np.sqrt(mse)
# 53.369566710321955
Python
복사
RMSLE(Root Mean Squared Logarithmic Error)
•
잔차(residual)에 대한 평균에 로그를 씌운 값
RMSE에 로그를 적용해준 지표
•
과대평가 된 항목보다 과소 평가 된 항목에 패널티를 주기위해
•
정답에 대한 오류를 숫자로 나타낸 값이 클 수록 오차가 크다는 의미이다.
◦
즉, 값이 작을 수록 오류가 적다는 의미를 나타낸다.
def rmsle(y, pred, convertExp=False):
if convertExp:
y = np.exp(y)
pred = np.exp(pred)
log1 = np.nan_to_num(np.array([np.log(v + 1) for v in y]))
log2 = np.nan_to_num(np.array([np.log(v + 1) for v in pred]))
calc = (log1 - log2)**2
return np.sqrt(np.mean(calc))
Python
복사
rmsle_score = rmsle(y_valid, pred)
rmsle_score
# 0.41800989606003214
Python
복사
MAE(Mean Absolute Error) = 평균 절대 오차
•
실제값과 예측값의 차이를 절대값으로 변환해서 평균화
from sklearn.metrics import mean_absolute_error
mae = mean_absolute_error(y_valid, pred)
mae
# 41.54850685988061
Python
복사
MAPE(Mean Absolute Percentage Error) = 평균 절대 비율 오차
•
실제값에 대한 절대오차 비율의 평균을 퍼센트로 표현
•
MSE, RMSE의 단점을 보완
from sklearn.metrics import mean_absolute_percentage_error
mean_absolute_percentage_error(y_valid, pred)
# 0.37310970433744683
Python
복사
SMAPE(Symmetric Mean Absolute Percentage Error)
•
기존 MAPE의 단점 보완
•
MAPE와 다른점은 각 실제값과 예측값을 절대값으로 변경후 합으로 나눈다.
•
MAPE와 다르게 실제값에 0이 존재해도 계산이 가능하다.
•
과소추정에 대한 패널티를 줄수가 있다.
def smape(true,pred):
error = np.abs(true-pred) / (np.abs(true) + np.abs(pred))
return np.mean(error)
smape(y_valid,pred)
# 0.1527140597913506
Python
복사
분류 모형 성능 평가 지표
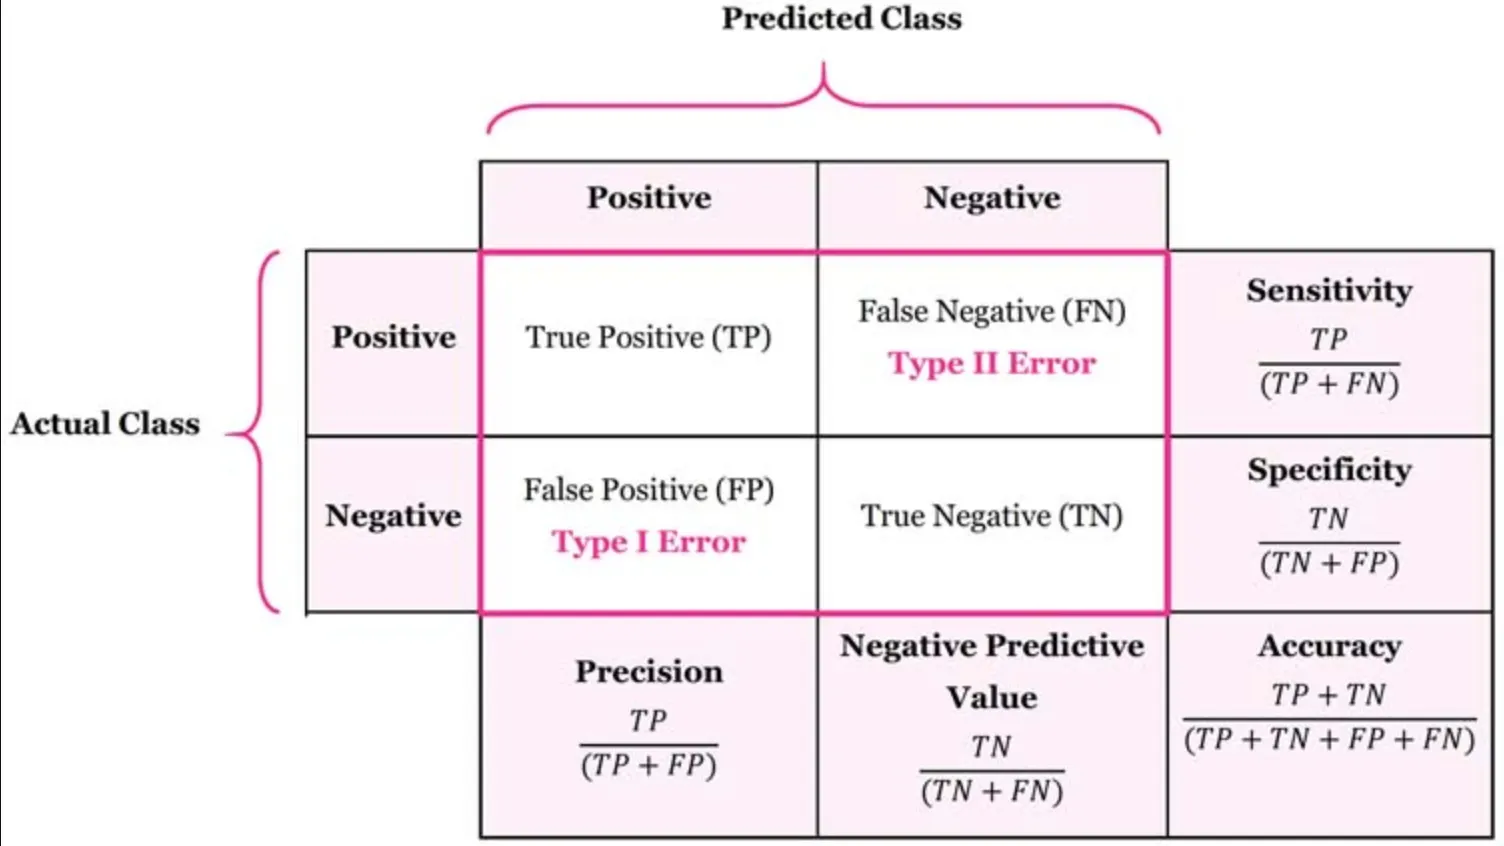
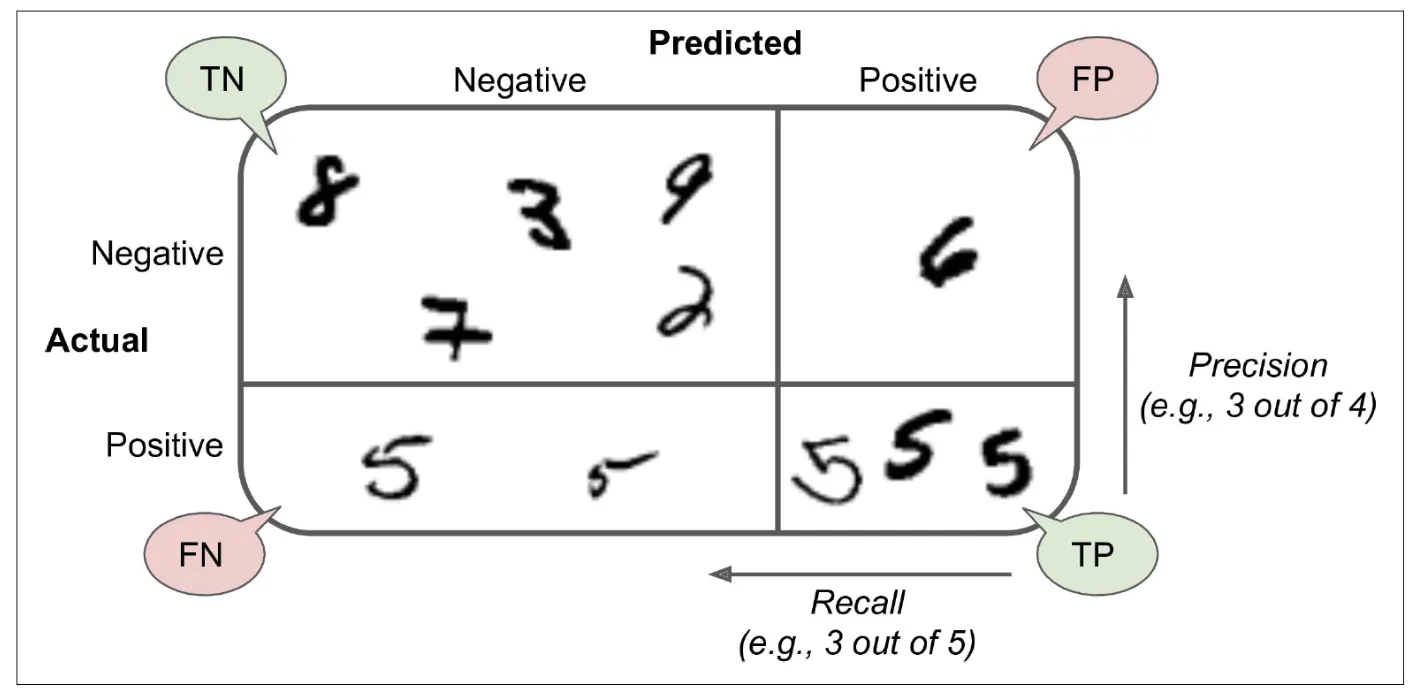
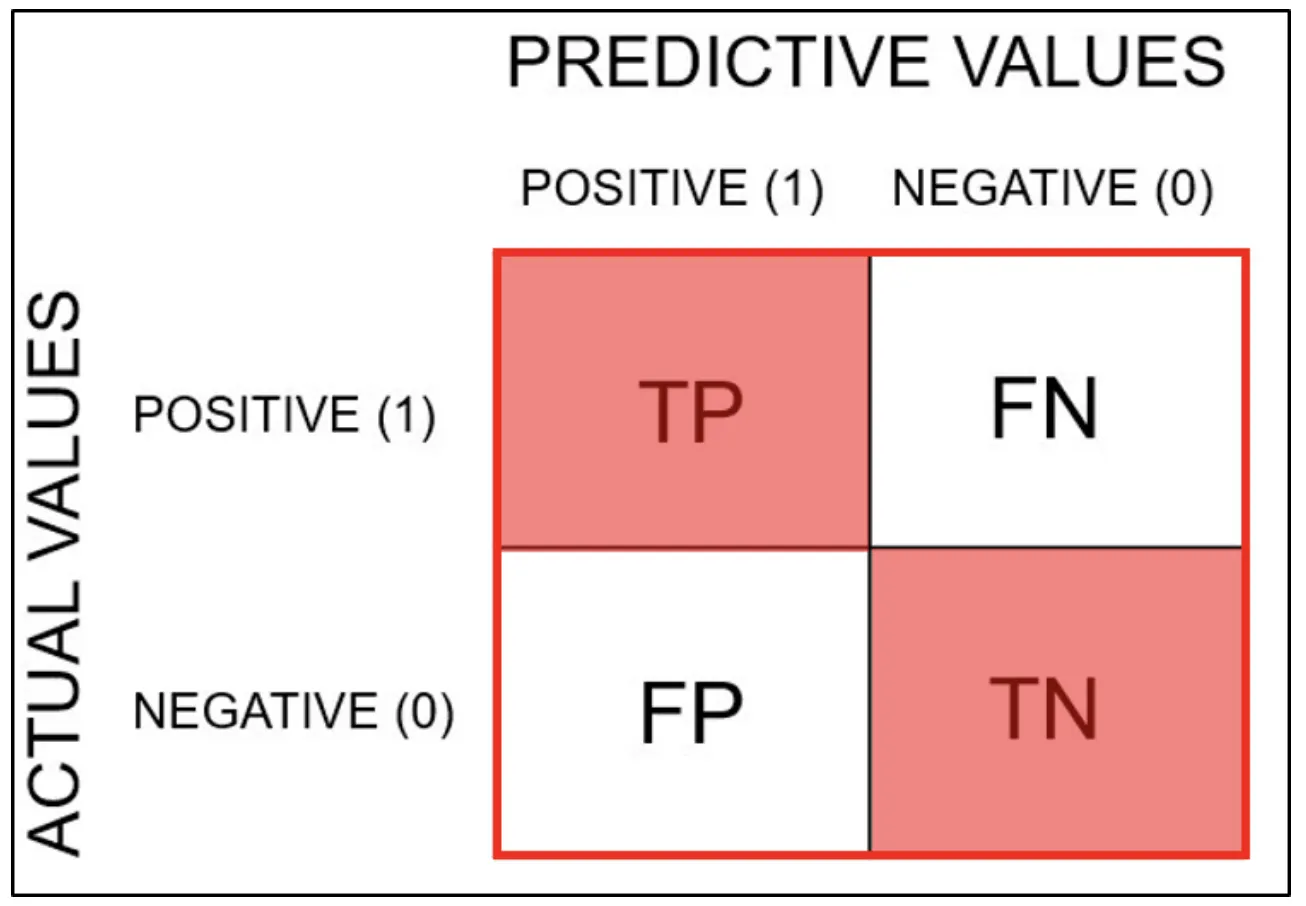
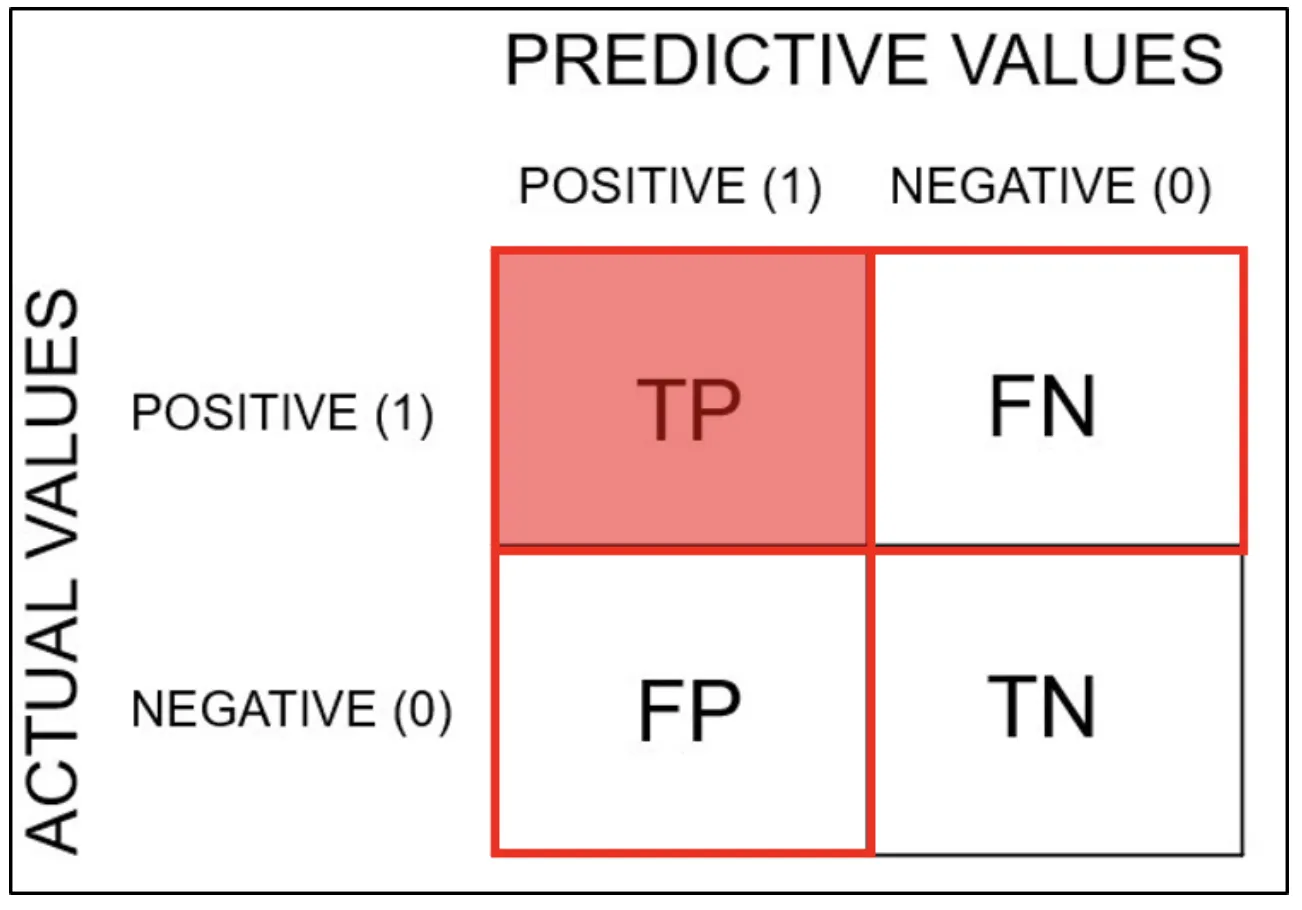
혼동행렬(Confusion Matrix)
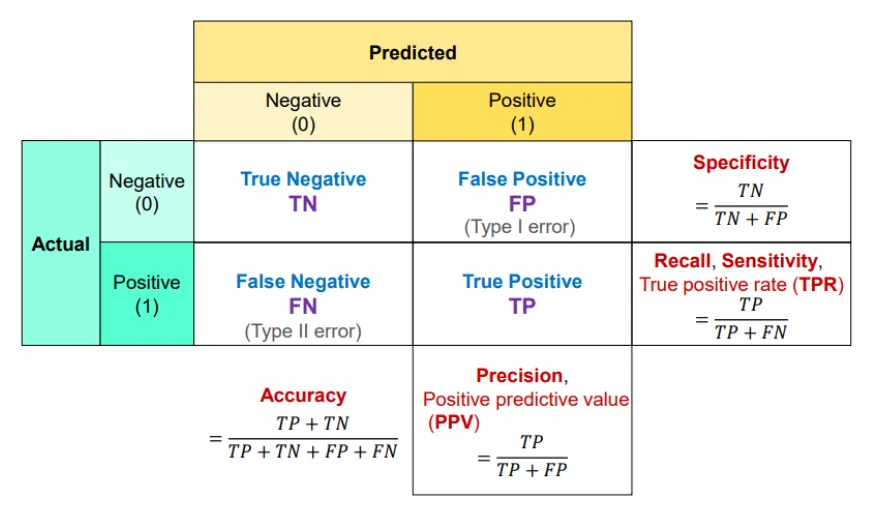
분석 모델에서 구한 분류의 예측 범주와 데이터의 실제 분류 범주를 교차 표 형태로 정리한 행렬
•
분류 범주
◦
TP(True Positive)
▪
참긍정.
▪
병에 관해 예라고 예측한 환자가 실제 병을 가진 경우
◦
TN(True Negative)
▪
참부정.
▪
병에 관해 아니오라고 예측한 환자가 실제로 병이 없는 경우
◦
FP(False Positive)
▪
거짓긍정.
▪
병에 관해 예라고 예측한 환자가 실제로는 병이 없는 경우
◦
FN(False Negative)
▪
거짓부정.
▪
병에 관해 아니오라고 예측한 환자가 실제로는 병이 있는 경우
•
계산 범주
◦
Accuracy: 정확도
◦
Specificity: 특이도
◦
Recall, Sensitivity: 민감도
◦
Precision: 정밀도
•
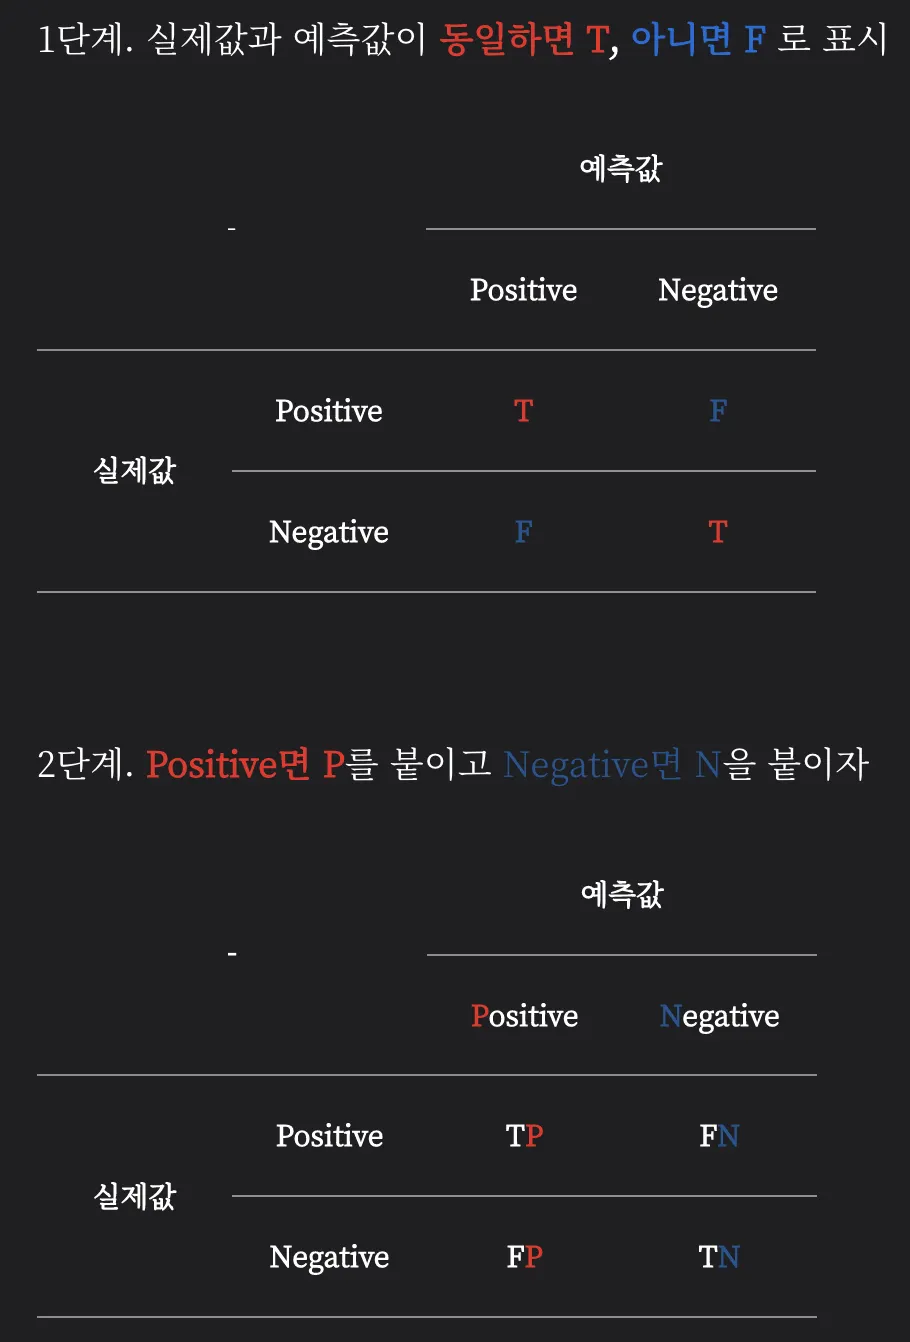
행렬 표기 순서
분류모델(SGDClassifier) 학습 및 예측
Data
import numpy as np
import pandas as pd
from sklearn.datasets import load_digits
digits = load_digits()
Python
복사
data = digits.data
# Binary Classifier
target = (digits.target == 5).astype(int)
Python
복사
from sklearn.model_selection import train_test_split
SEED = 42
x_train, x_valid, y_train, y_valid = train_test_split(data, target, random_state=SEED)
x_train.shape , x_valid.shape, y_train.shape, y_valid.shape
# ((1347, 64), (450, 64), (1347,), (450,))
Python
복사
# 원본 데이터
digit = data[5]
digits.target[5]
# 5
# 변경한 데이터
target[5]
# 1
Python
복사
Modeling
from sklearn.linear_model import SGDClassifier
sgd_clf = SGDClassifier(random_state=42)
sgd_clf.fit(x_train, y_train)
sgd_clf.predict([digit])
# array([0])
Python
복사
from sklearn.model_selection import cross_val_predict # 교차검증
y_train_pred = cross_val_predict(sgd_clf, x_train, y_train, cv=5)
Python
복사
Confusion Matrix
•
y_true: 실제 타깃 레이블이 담긴 1차원 배열
•
y_pred: 예측한 레이블이 담긴 1차원 배열
•
labels: 클래스 레이블로 사용될 값의 리스트. 기본값은 None으로, 레이블은 y_true와 y_pred의 고유한 값으로 설정됩니다.
•
sample_weight: 샘플 가중치. 기본값은 None으로, 모든 샘플의 가중치가 1로 설정됩니다.
•
normalize: 정규화 방식을 설정하는 문자열. 기본값은 None으로, 오차 행렬의 각 셀은 클래스당 실제 샘플 수로 계산됩니다. normalize=True로 설정하면, 각 클래스당 오차 행렬의 셀 값을 해당 클래스의 전체 샘플 수로 나누어 정규화합니다. normalize='pred'로 설정하면, 각 클래스당 오차 행렬의 셀 값을 해당 클래스를 예측한 전체 샘플 수로 나누어 정규화합니다. normalize='true'로 설정하면, 각 클래스당 오차 행렬의 셀 값을 해당 클래스를 실제 값으로 가진 전체 샘플 수로 나누어 정규화합니다.
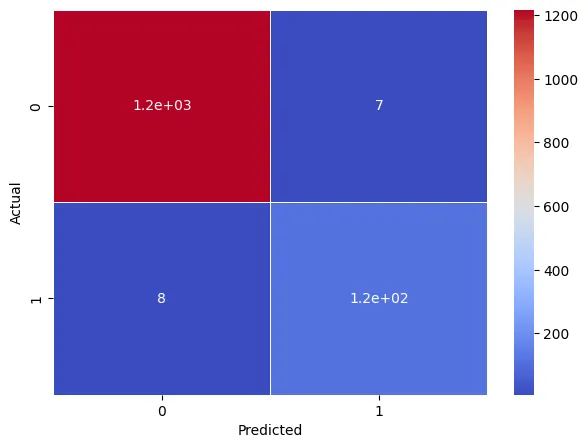
from sklearn.metrics import confusion_matrix
conf_mx = confusion_matrix(y_train, y_train_pred)
conf_mx
# array([[1217, 7],
# [ 8, 115]])
Python
복사
plt.figure(figsize=(7,5))
sns.heatmap(conf_mx, annot=True, cmap="coolwarm", linewidth=0.5)
plt.xlabel('Predicted')
plt.ylabel('Actual')
plt.show()
Python
복사
◦
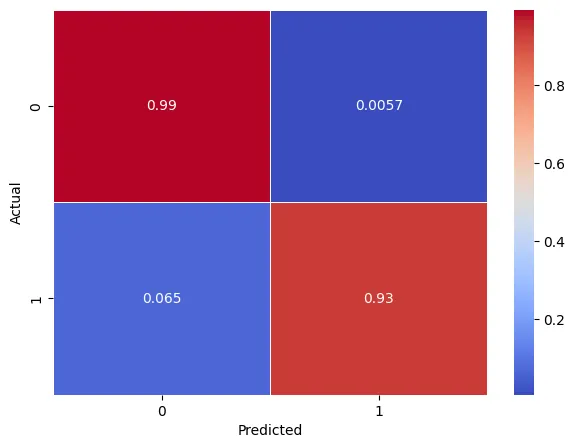
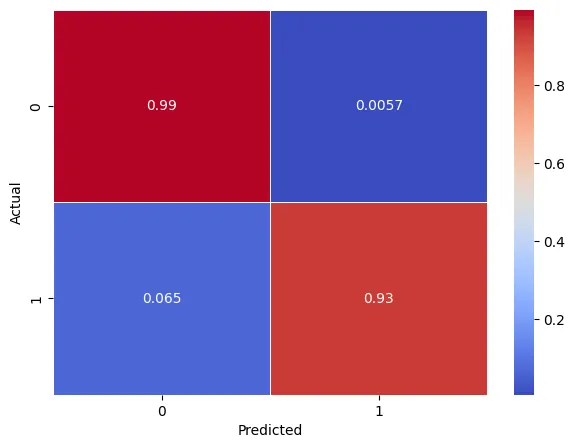
상기 이미지와 비교하면 알 수 있듯이, 확률값으로 비교를 해야 정확하게 확인할 수 있습니다.
norm_conf_mx = confusion_matrix(y_train, y_train_pred, normalize="true")
norm_conf_mx
# array([[0.99428105, 0.00571895],
# [0.06504065, 0.93495935]])
Python
복사
plt.figure(figsize=(7,5))
sns.heatmap(norm_conf_mx, annot=True, cmap="coolwarm", linewidth=0.5)
plt.xlabel('Predicted')
plt.ylabel('Actual')
plt.show()
Python
복사
평가지표
•
Recall : 전체 데이터 5의 갯수 중 모델이 맞춘 5의 갯수
모델 예측
•
Dummy 예측
from sklearn.dummy import DummyClassifier
dummy = DummyClassifier(strategy='most_frequent')
dummy.fit(x_train,y_train)
pred_dummy = dummy.predict(x_valid)
Python
복사
•
똒똒한 모델 예측
from sklearn.linear_model import SGDClassifier
sgd_clf = SGDClassifier(random_state=42)
sgd_clf.fit(x_train, y_train)
pred_clf = sgd_clf.predict(x_valid)
Python
복사
Accuracy(정확도)
•
올바른 총 예측 수의 비율
•
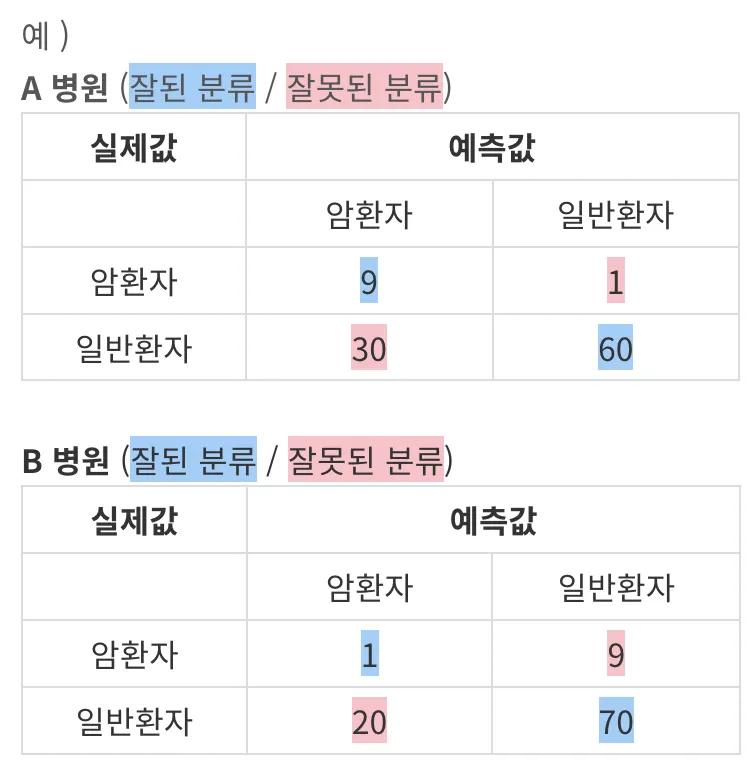
예시
◦
A병원의 정확도 = (9+60) / (9+60+1+30) = 0.69
◦
B병원의 정확도 = (1+70) / (1+70+9+20) = 0.71
정확도는 B병원이 높지만 암을 기준으로 하면 B가 더 안좋다.
•
Accuracy의 한계
◦
오류중에서 FN 오류를 줄이는 것이 더 중요한 경우
◦
오류 중에 FP 오류를 줄이는 것이 더 중요한 경우
◦
정확도는 위에 두가지 오류에 정도의 차이를 구분할수 없기 때문에 적절한 성능지표가 될수 없다.
◦
음성(0)이 양성(1)보다 훨씬 많은경우 음성(0)으로만 예측해도 높은 정확도를 보이기 때문에 적절한 성능지표가 될수없다.
from sklearn.metrics import accuracy_score
score = accuracy_score(y_valid, pred_dummy)
print(f"dummy: {score}")
score = accuracy_score(y_valid, pred_clf)
print(f"model: {score}")
# dummy: 0.8688888888888889
# model: 0.9866666666666667
Python
복사
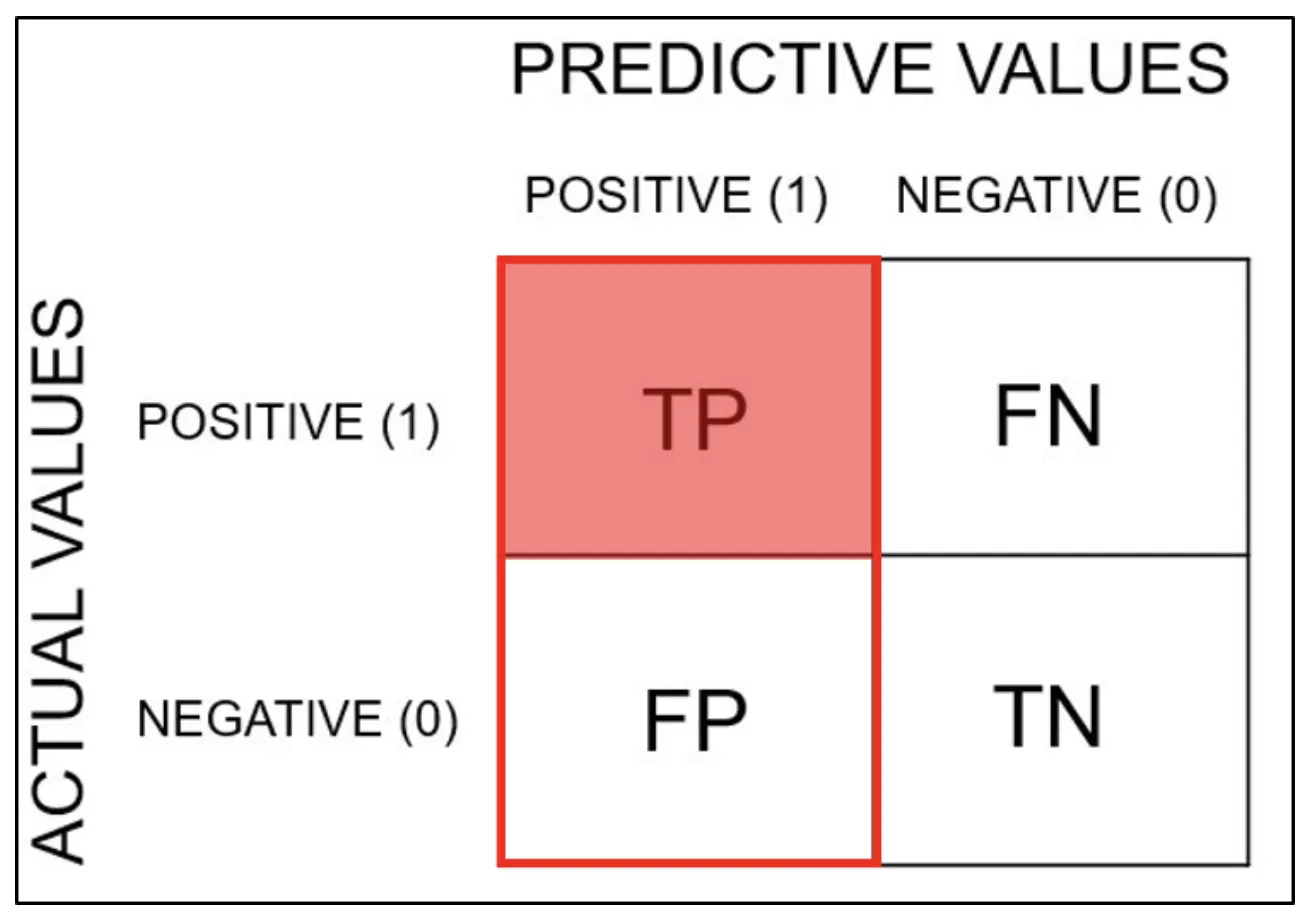
Precision(정밀도)
•
정밀도는 올바르게 분류된 긍정적인 예의 총 수와 예측된 긍정적인 예의 총 수의 비율이다. 긍정적인 예측에서 얻은 정확성을 보여준다.
•
FP 줄이는 것이 목표일 때 사용
•
예)
◦
A모델의 암환자 정밀도 = 9/(9+30) = 0.23
◦
B모델의 암환자 정밀도 = 1/(1+20) = 0.04
정확도는 B모델이 높지만 정밀도는 A모델이 높다.
from sklearn.metrics import precision_score
score = precision_score(y_valid, pred_dummy)
print(f"dummy: {score}")
score = precision_score(y_valid, pred_clf)
print(f"model: {score}")
# dummy: 0.0
# model: 1.0
# /usr/local/lib/python3.10/dist-packages/sklearn/metrics/_classification.py:1344: UndefinedMetricWarning: Precision is ill-defined and being set to 0.0 due to no predicted samples. Use `zero_division` parameter to control this behavior.
# _warn_prf(average, modifier, msg_start, len(result))
Python
복사
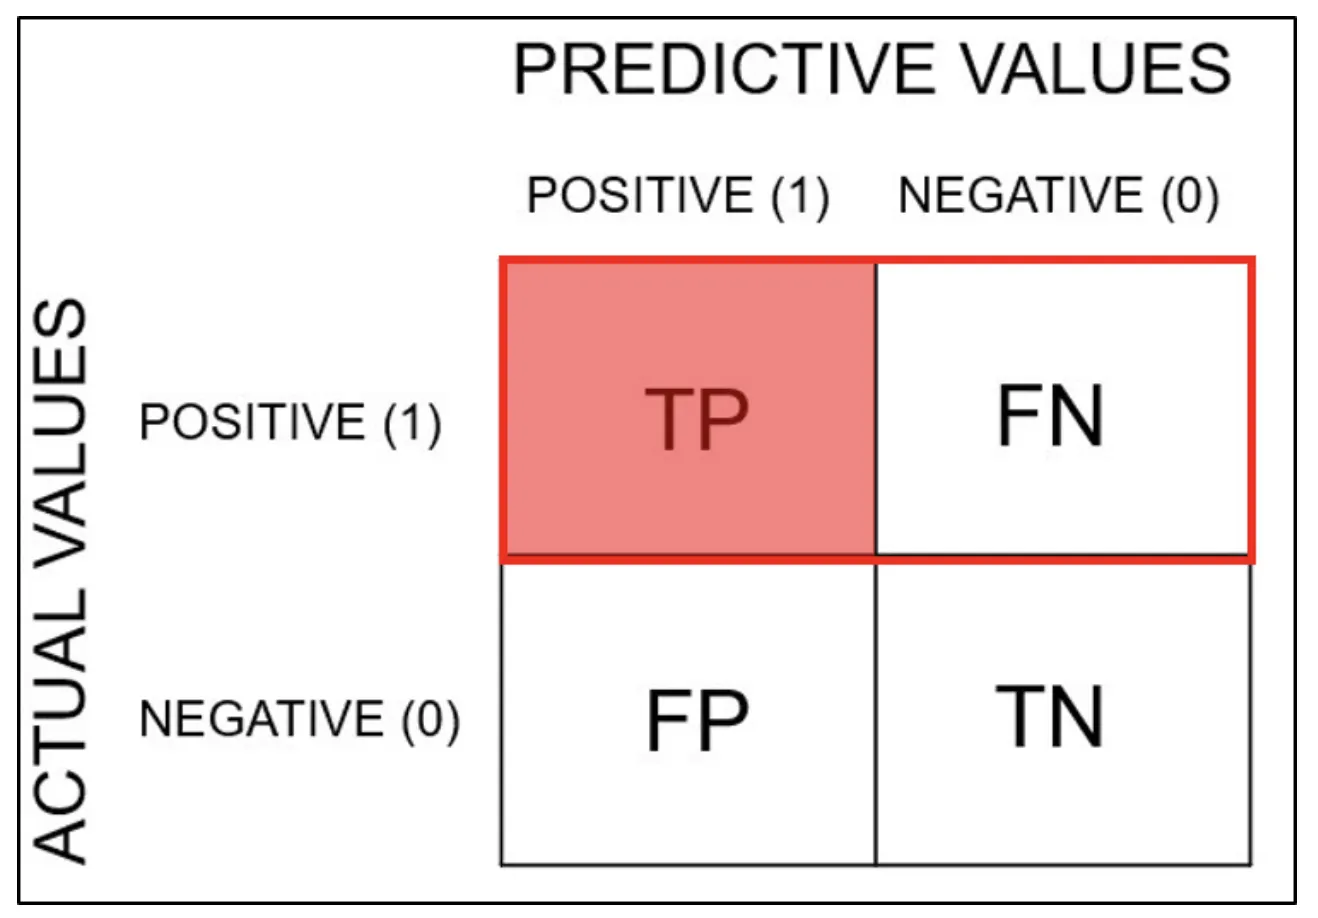
Sensitivity(민감도) = Recall(재현도) = TPR
•
민감도는 TPR(True Positivie Rate) 또는 Recall이라고도 한다.
•
분류기에 의해 양성으로 분류된 양성 사례의 척도이다.
•
FN 줄이는 것이 목표일 때 사용
•
예시
◦
A모델의 암환자 재현율 = 9/(9+1) = 0.9
◦
B모델의 암환자 재현율 = 1/(1+9) = 0.1
암환자 재현율을 기준으로 더 나은 모델은 A모델이다.
실제 암환자들이 병원에 갔을 때, 암환자라고 예측될 확률.
조기에 정확하게 발견해서 신속하게 처리할 수 있는 올바른 모델.
from sklearn.metrics import recall_score
score = recall_score(y_valid, pred_dummy)
print(f"dummy: {score}")
score = recall_score(y_valid, pred_clf)
print(f"model: {score}")
# dummy: 0.0
# model: 0.8983050847457628
Python
복사
F1 Score
•
F1 Score는 분류 모델에서 사용되는 머신러닝 Metric입니다.
•
Precision(정밀도)과 Recall(재현도)으로 F1 Score가 구성되고 불균형한 데이터가 잘 동작하는지에 대한 평가지표가 됩니다.
•
더미, 모델
from sklearn.metrics import f1_score
score = f1_score(y_valid, pred_dummy)
print(f"dummy: {score}")
score = f1_score(y_valid, pred_clf)
print(f"model: {score}")
# dummy: 0.0
# model: 0.9464285714285715
Python
복사
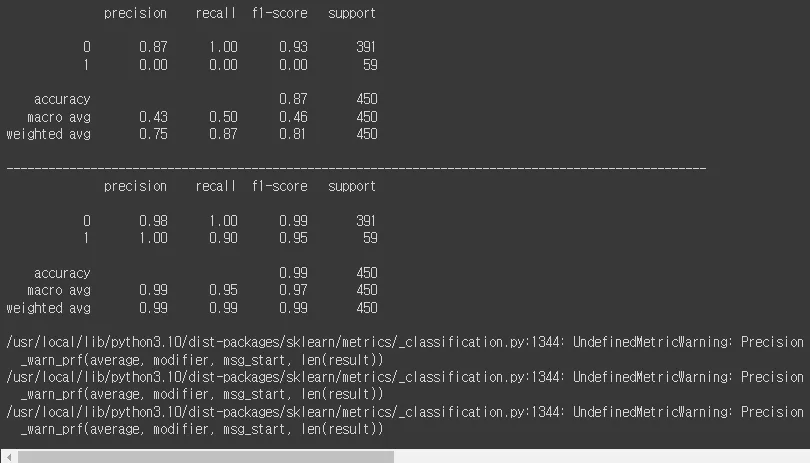
from sklearn.metrics import classification_report
print(classification_report(y_valid, pred_dummy))
print('-'*100)
print(classification_report(y_valid, pred_clf))
Python
복사
Precision-Recall Trade-off
•
임계값(Thresholds)
◦
모델은 분류에서 확률(0~1) 또는 음수에서 양수 사이에 실수를 예측값으로 출력
◦
사이킷런에서는 predict_proba(), dicision_funtion() 제공
pred_proba = sgd_clf.decision_function(x_valid)
threshold = 0 # 사이킷런의 디폴트값
pred = np.where(pred_proba > threshold , 1 , 0)
precision_score(y_valid,pred) , recall_score(y_valid,pred)
# (1.0, 0.8983050847457628)
threshold = 30000
pred = np.where(pred_proba > threshold , 1 ,0)
precision_score(y_valid,pred) , recall_score(y_valid,pred)
# /usr/local/lib/python3.10/dist-packages/sklearn/metrics/_classification.py:1344: UndefinedMetricWarning: Precision is ill-defined and being set to 0.0 due to no predicted samples. Use `zero_division` parameter to control this behavior.
# _warn_prf(average, modifier, msg_start, len(result))
# (0.0, 0.0)
threshold = -30000
pred = np.where(pred_proba > threshold , 1 ,0)
precision_score(y_valid,pred) , recall_score(y_valid,pred)
# (0.13111111111111112, 1.0)
Python
복사
▪
DecisionTreeClassifier
from sklearn.tree import DecisionTreeClassifier
# 모델 생성
tree = DecisionTreeClassifier(max_depth=3,random_state=SEED)
# 모델 학습
tree.fit(x_train,y_train)
# 모델 평가: predict -> predict_proba(확률)을 이용해 threshold를 적용할 결과
pred_tree = tree.predict(x_valid)
pred_tree[:3]
# array([0, 0, 0])
pred_proba = tree.predict_proba(x_valid)[:,1]
pred_proba[:3]
# array([0.02371542, 0.01059322, 0.01059322])
threshold = 0.5 # 사이킷런의 디폴트값
pred = np.where(pred_proba > threshold , 1 ,0)
precision_score(y_valid,pred) , recall_score(y_valid,pred)
# (0.9811320754716981, 0.8813559322033898)
threshold = 0.9
pred = np.where(pred_proba > threshold , 1 ,0)
precision_score(y_valid,pred) , recall_score(y_valid,pred)
# (0.9811320754716981, 0.8813559322033898)
threshold = 0.1
pred = np.where(pred_proba > threshold , 1 ,0)
precision_score(y_valid,pred) , recall_score(y_valid,pred)
# (0.8813559322033898, 0.8813559322033898)
Python
복사
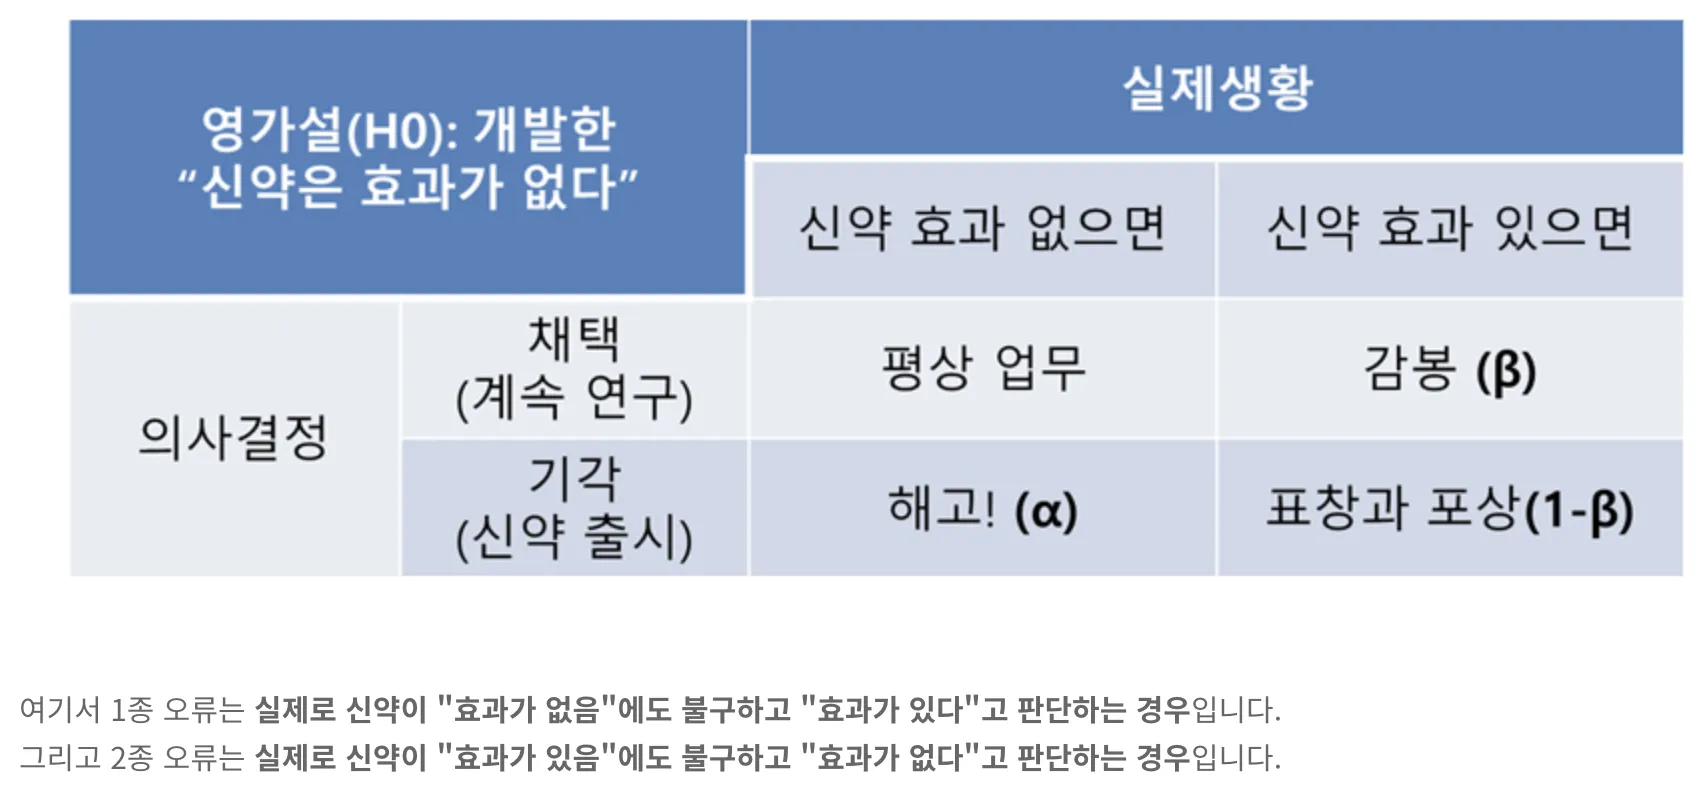
1종 오류, 2종 오류
•
•
◦
1종 오류
귀무가설(H0)가 실제로는 참이어서 채택해야 함에도 불구하고 표본의 오차 때문에 이를 채택하지 않은 오류를 말합니다.
보통 α(알파)로 표기하고 유의수준이라고 부릅니다.
◦
2종 오류
귀무가설(H0)가 거짓이라서 채택하지 말아야 하는데, 표본의 오차 때문에 이를 채택하는 오류를 말합니다.
보통 β(베타)로 표기
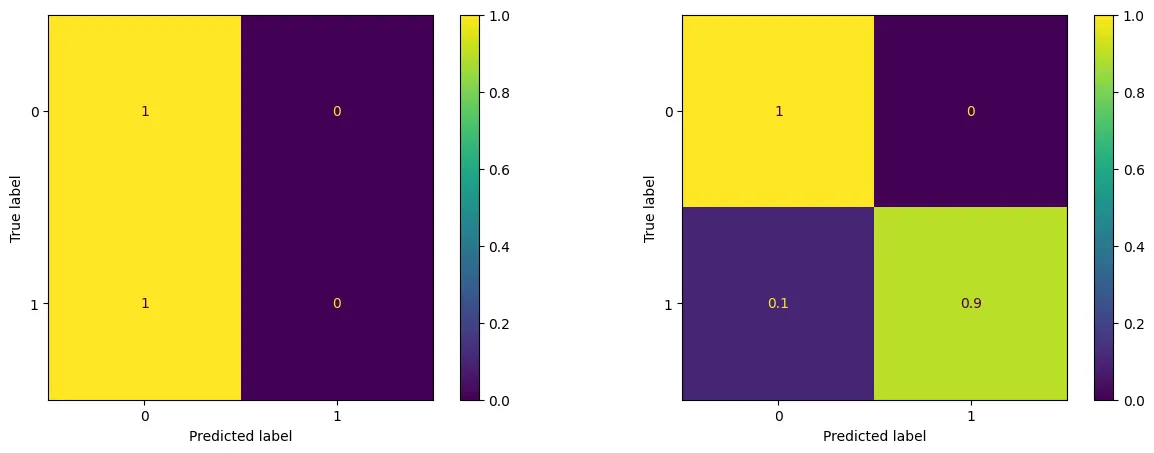
from sklearn.metrics import confusion_matrix, ConfusionMatrixDisplay
fig , ax = plt.subplots(1,2,figsize=(15,5))
cm = confusion_matrix(y_valid,pred_dummy, normalize="true")
disp = ConfusionMatrixDisplay(confusion_matrix=cm)
disp.plot(ax = ax[0])
cm = confusion_matrix(y_valid,pred_clf, normalize="true")
disp = ConfusionMatrixDisplay(confusion_matrix=cm)
disp.plot(ax = ax[1])
plt.show()
Python
복사
from sklearn.metrics import confusion_matrix
confusion_matrix(y_valid, pred_clf)
# array([[391, 0],
# [ 6, 53]])
Python
복사
•
α 오류: 0개
•
β 오류: 6개
•
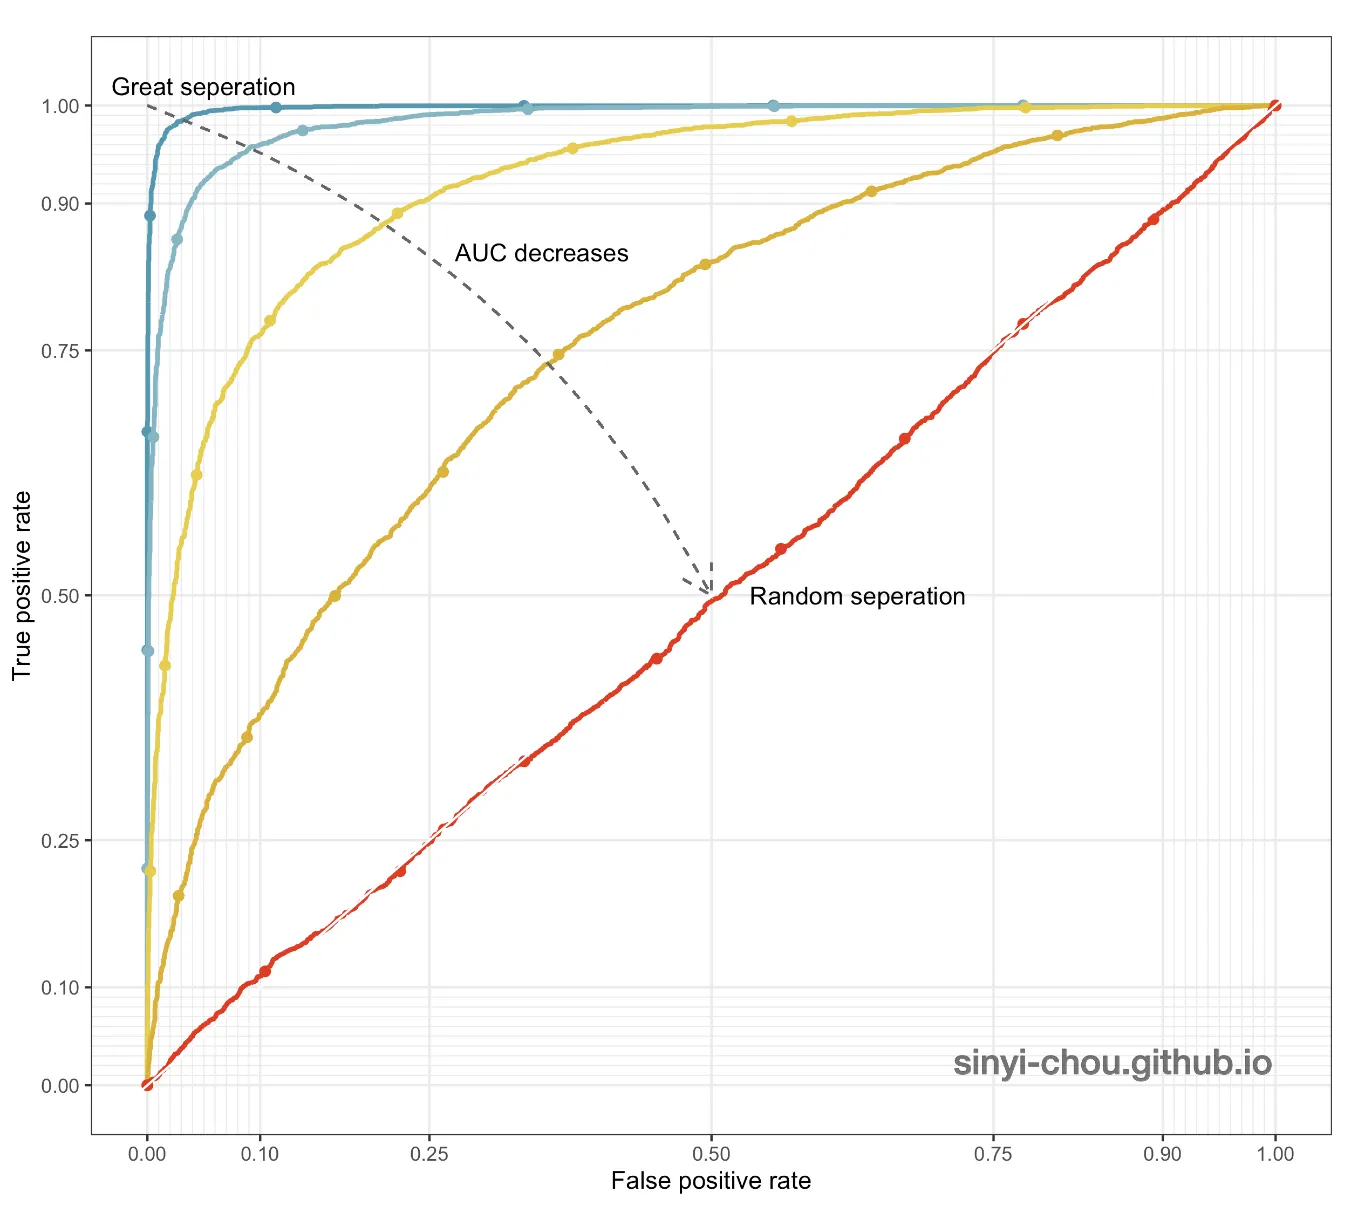
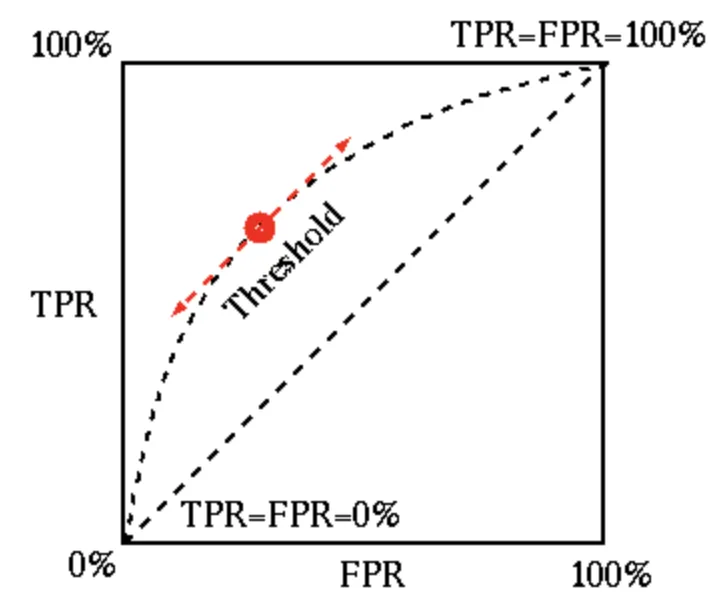
FPR를 X축으로, TPR을 Y축으로 정의하여 둘간의 관계를 표현한 그래프
◦
FPR(특이도) =FP / FP+TN
◦
TPR(민감도) =TP / FN+TP
AUROC (Area Under ROC curve)
•
ROC Curve의 밑부분 면적
•
넓을수록 모형 성능이 좋다.
•
임계값(threshold)이 어떻게 선택되었는지와 무관하게 모델의 예측 품질을 측정할 수 있다.
◦
Poor model: 0.5 ~ 0.7
◦
Fair model: 0.7 ~ 0.8
◦
Good model: 0.8 ~ 0.9
◦
Excellent model: 0.9 ~ 1.0
pred_dummy = dummy.predict_proba(x_valid)[:,1] # 1에 대한 확률만 가져오겠다.
pred_tree = tree.predict_proba(x_valid)[:,1]
Python
복사
from sklearn.metrics import roc_curve, auc
fpr, tpr, thresholds = roc_curve(y_valid,pred_dummy)
print(f'dummy: {auc(fpr, tpr)}')
print('-'*50)
fpr, tpr, thresholds = roc_curve(y_valid,pred_tree)
print(f'model: {auc(fpr, tpr)}')
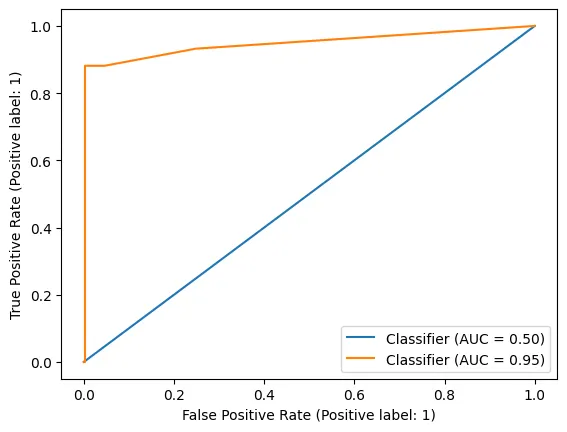
# dummy: 0.5
# --------------------------------------------------
# model: 0.9479604664268065
Python
복사
from sklearn.metrics import RocCurveDisplay
fig,ax = plt.subplots()
RocCurveDisplay.from_predictions(y_valid,pred_dummy,ax=ax)
RocCurveDisplay.from_predictions(y_valid,pred_tree,ax=ax)
plt.show()
Python
복사
confusion_matrix
conf_mx = confusion_matrix(y_valid, pred_clf)
conf_mx
# array([[391, 0],
# [ 6, 53]])
Python
복사
plt.figure(figsize=(7,5))
sns.heatmap(norm_conf_mx, annot=True, cmap="coolwarm", linewidth=0.5)
plt.xlabel('Predicted')
plt.ylabel('Actual')
plt.show()
Python
복사
다중 분류 모형 예제
Modeling
digits = load_digits()
data = digits.data
target = digits.target
x_train,x_valid,y_train,y_valid = train_test_split(data,target,random_state=SEED)
x_train.shape, x_valid.shape, y_train.shape, y_valid.shape
# ((1347, 64), (450, 64), (1347,), (450,))
Python
복사
tree = DecisionTreeClassifier(max_depth = 5 , random_state=SEED)
tree.fit(x_train,y_train)
pred = tree.predict(x_valid)
Python
복사
결과 확인
classification_report
print(classification_report(y_valid,pred))
precision recall f1-score support
0 1.00 0.91 0.95 43
1 0.32 0.32 0.32 37
2 0.56 0.66 0.60 38
3 0.87 0.85 0.86 46
4 0.80 0.78 0.79 55
5 0.73 0.19 0.30 59
6 0.95 0.89 0.92 45
7 0.90 0.68 0.78 41
8 0.37 0.61 0.46 38
9 0.52 0.85 0.65 48
accuracy 0.67 450
macro avg 0.70 0.67 0.66 450
weighted avg 0.71 0.67 0.66 450
Python
복사
confusion_matrix
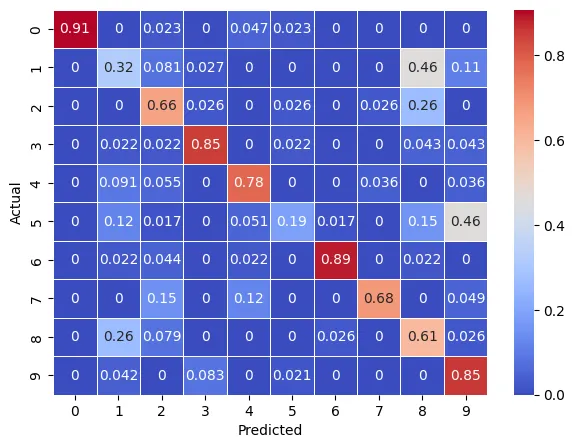
norm_conf_mx = confusion_matrix(y_valid, pred, normalize="true")
norm_conf_mx
array([[0.90697674, 0. , 0.02325581, 0. , 0.04651163,
0.02325581, 0. , 0. , 0. , 0. ],
[0. , 0.32432432, 0.08108108, 0.02702703, 0. ,
0. , 0. , 0. , 0.45945946, 0.10810811],
[0. , 0. , 0.65789474, 0.02631579, 0. ,
0.02631579, 0. , 0.02631579, 0.26315789, 0. ],
[0. , 0.02173913, 0.02173913, 0.84782609, 0. ,
0.02173913, 0. , 0. , 0.04347826, 0.04347826],
[0. , 0.09090909, 0.05454545, 0. , 0.78181818,
0. , 0. , 0.03636364, 0. , 0.03636364],
[0. , 0.11864407, 0.01694915, 0. , 0.05084746,
0.18644068, 0.01694915, 0. , 0.15254237, 0.45762712],
[0. , 0.02222222, 0.04444444, 0. , 0.02222222,
0. , 0.88888889, 0. , 0.02222222, 0. ],
[0. , 0. , 0.14634146, 0. , 0.12195122,
0. , 0. , 0.68292683, 0. , 0.04878049],
[0. , 0.26315789, 0.07894737, 0. , 0. ,
0. , 0.02631579, 0. , 0.60526316, 0.02631579],
[0. , 0.04166667, 0. , 0.08333333, 0. ,
0.02083333, 0. , 0. , 0. , 0.85416667]])
Python
복사
plt.figure(figsize=(7,5))
sns.heatmap(norm_conf_mx, annot=True, cmap="coolwarm", linewidth=0.5)
plt.xlabel('Predicted')
plt.ylabel('Actual')
plt.show()
Python
복사
Multi Classification 분류 방법
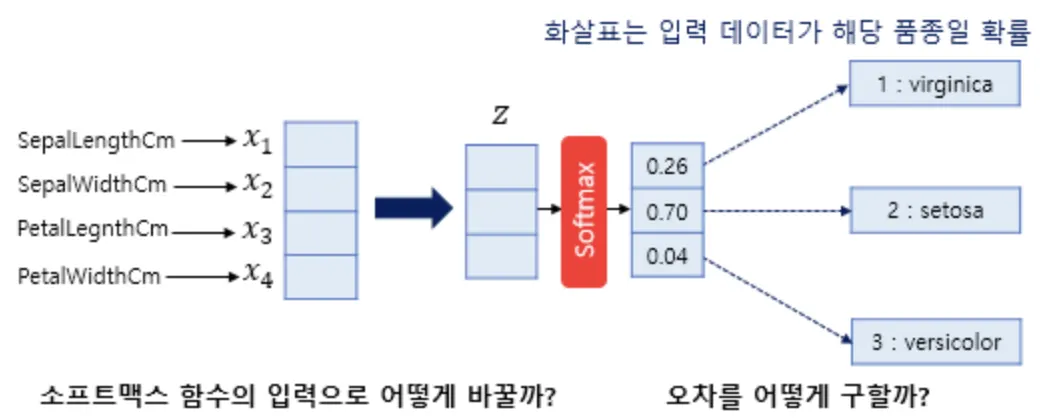
소프트맥스 함수(Softmax Function)
•
다중 분류를 할 때 소프트맥스를 주로 사용
•
각 클래스에 대한 확률을 출력
•
입력받은 값들을 0~1사이의 값들로 모두 정규화하며 출력값들의 합은 항상 1이 되는 특성을 가진 함수
아래소스코드의 소프트맥스식은 지수함수의 특성상 값이 급격히 커져 오버플로우 오류를 조금이라도 방지하고자 입력 값 중 최대값을 이용하여 모든 입력에서 동일하게 빼고 계산하였다.
동일하게 뺀 경우와 그렇지 않은 경우의 소프트맥스 값은 수학적으로 같다.
import numpy as np
import matplotlib.pyplot as plt
def softmax(x):
e_x = np.exp(x - np.max(x))
return e_x / e_x.sum()
x = np.array([1.0,1.0,2.0])
y = softmax(x)
print(np.sum(y))
ratio = y
labels = y
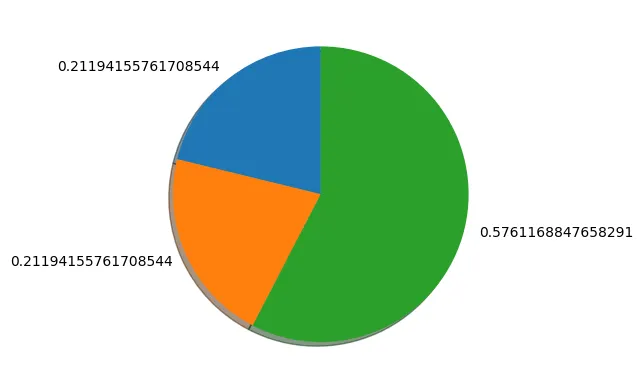
plt.pie(ratio, labels=labels, shadow=True, startangle=90)
# 1.0
plt.show()
Python
복사
소프트맥스 입력값: 1.0, 1.0, 2.0
소프트맥스 출력값(반올림): 0.2, 0.2, 0.6
◦
출력값이 0.25, 0.25, 0.5가 아닌 0.2, 0.2, 0.6이 나왔다. 이런 결과가 나온 이유는 바로 exp(x) 때문이다.
◦
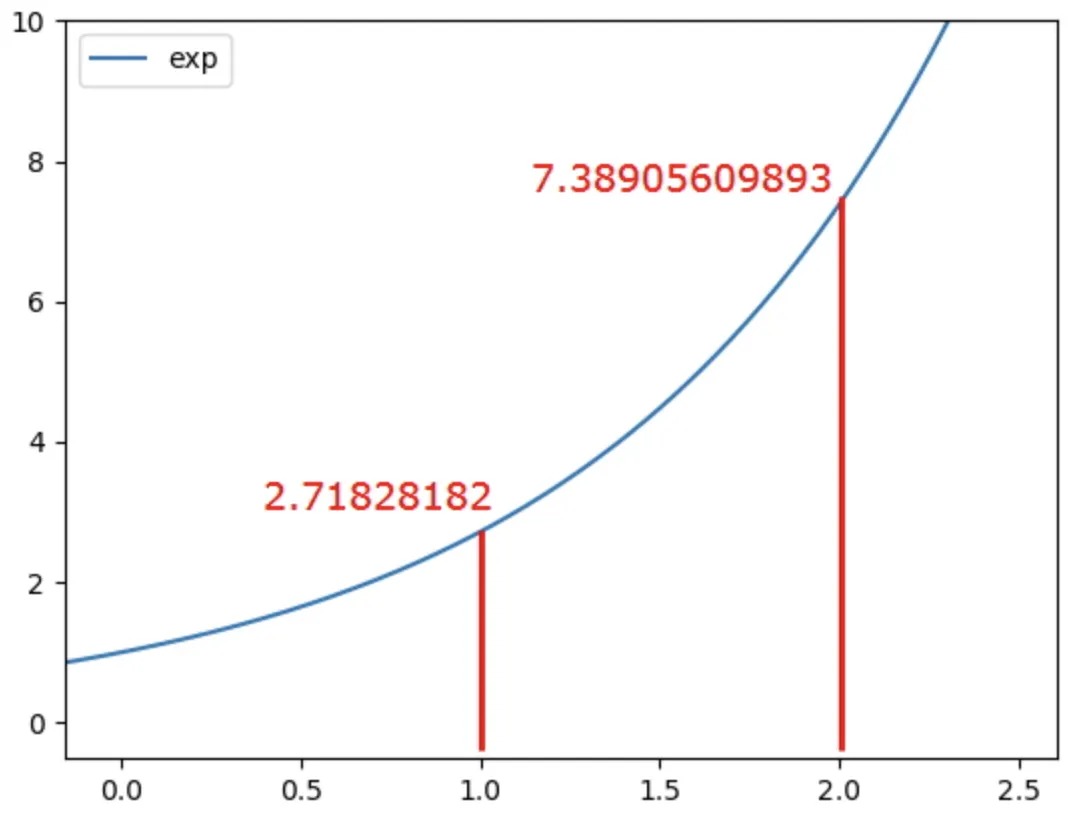
소프트맥스는 1과 2가 아닌 e^1 = 2.718, e^2 = 7.389 값을 계산에 이용한다.
◦
즉 입력값이 커짐에 따라 기울기가 증가하며 더 큰 차이가 발생한다. 따라서 0.2, 0.2, 0.6이 나온 것이다.
소프트맥스를 이용한 분류
x = tree.predict_proba(x_valid)[0]
y = softmax(x)
print(f'소프트맥스 출력합: {np.sum(y)}')
# 1.0
ratio = y
labels = [0,1,2,3,4,5,6,7,8,9]
plt.pie(ratio, labels=labels, shadow=True, startangle=90)
plt.show()
Python
복사
x_valid.shape
# (450, 64)
tree.predict_proba(x_valid).shape
# (450, 10)
import matplotlib as mpl
import matplotlib.pyplot as plt
# 벡터 변환
digit_img = x_valid[0].reshape(8, 8)
plt.imshow(digit_img, cmap="gray")
plt.axis("off")
plt.show()
Python
복사
Multi Classification 평가 방법
F1-Score
•
micro
전체 클래스의 대하여 TP/FP/FN 구한 뒤에 F1-Score 계산
•
macro
각 클래스에 대하여 F1-Score 계산뒤 산술 평균
•
weighted
각 클래스에 대하여 F1-Score 계산뒤 각 클래스가 차지하는 비율에 따라 가중평균
f1_score(y_valid, pred, average="micro")
# 0.6688888888888889
f1_score(y_valid, pred, average="macro")
# 0.6620047429878985
f1_score(y_valid, pred, average="weighted")
# 0.6616398619763888
Python
복사
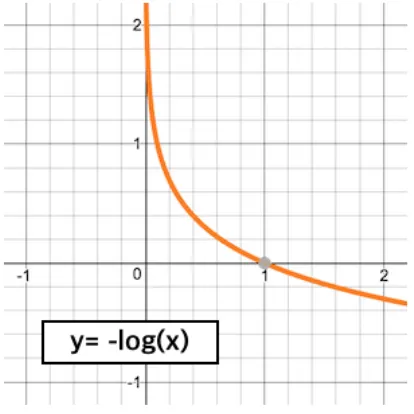
logloss
•
모델이 예측한 확률 값을 반영해서 평가한다.
•
0에 가까울 수록 좋은 모델
•
정답에 해당하는 확률값들을 음의 로그함수에 넣어서 나온값들을 평균내서 평가
음의 로그함수
•
1을 넣으면 0이나온다. 0에 가까운 값을 넣을 수록 큰값이 나온다.
from sklearn.metrics import log_loss
pred = tree.predict_proba(x_valid)
log_loss(y_valid,pred)
# 2.1647396191436967
Python
복사

