설명
데이터 시각화와 2D 그래프 플롯에 사용되는 파이썬 라이브러리
설치
colab 한글 깨짐 방지
•
실행 후 런타임 재 시작
import pandas as pd
import numpy as np
Python
복사
!apt -qq -y install fonts-nanum > /dev/null
import matplotlib.pyplot as plt
import matplotlib.font_manager as fm
fontpath = '/usr/share/fonts/truetype/nanum/NanumBarunGothic.ttf'
font_name = fm.FontProperties(fname=fontpath).get_name()
fm._rebuild()
%config InlineBackend.figure_format = 'retina'
plt.rc('font', family=font_name)
plt.rcParams['axes.unicode_minus'] = False
Python
복사
기초
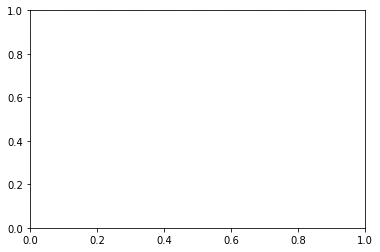
틀 만들기
plt.figure() # 그래프를 그리기위한 틀을 만든다.
plt.axes() # 틀틀안에 좌표평면들을 그린다.
plt.show() # 실제 화면에 표시한다.
Python
복사
plot
•
line plot을 그려주는 함수
•
figure, axes 없으면, 이를 만들어서 그려준다.
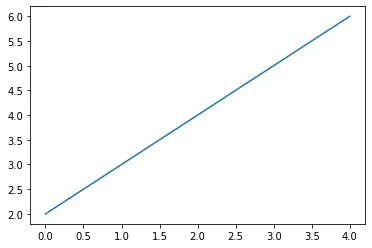
단일 그래프
•
단일 그래프 생성
plt.plot(np.arange(2,7))
plt.show()
Python
복사
다중 그래프
•
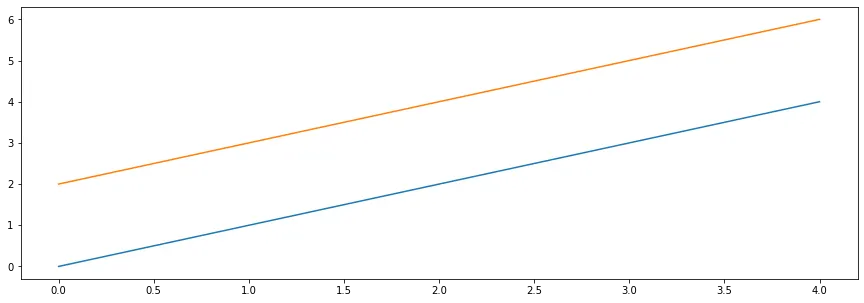
1개의 axes 안에 여러개의 그래프를 그린다.
# 틀 크기 (너비, 높이)
plt.figure(figsize=[15,5])
# 그래프 2개
plt.plot(np.arange(5))
plt.plot(np.arange(2,7))
# 화면에 표시
plt.show()
Python
복사
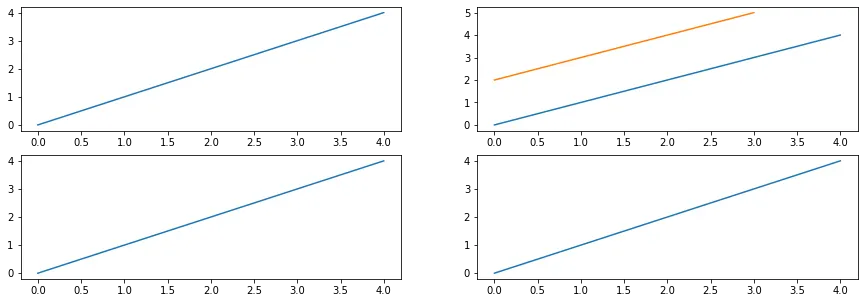
subplots
•
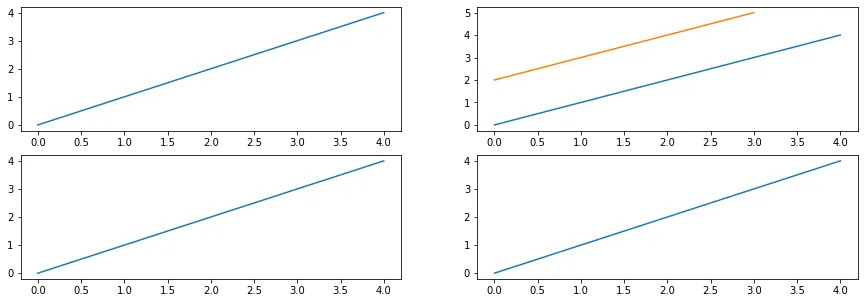
하나의 그림 안에 여러 개의 그래프를 배치
fig, ax = plt.subplots(2,2,figsize=[15,5])
print(ax.shape)
# (2, 2)
# 첫번째 로우 & 왼쪽
ax[0,0].plot(np.arange(5))
# 첫번째 로우 & 오른쪽
ax[0,1].plot(np.arange(5))
ax[0,1].plot(np.arange(2,6))
# 두번째 로우 & 왼쪽
ax[1,0].plot(np.arange(5))
# 두번째 로우 & 오른쪽
ax[1,1].plot(np.arange(5))
plt.show()
Python
복사
•
예제
타이틀
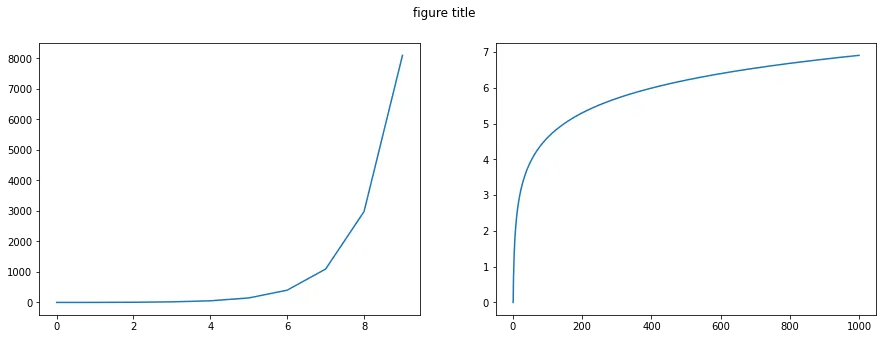
figure의 제목: suptitle()
fig , ax = plt.subplots(1,2,figsize=(15,5))
fig.suptitle("figure title")
x = range(0,10) # x축
y = np.exp(x) # y축
ax[0].plot(x,y)
x = range(1,1000) # x 축
y = np.log(x) # y 축
ax[1].plot(x,y)
plt.show()
Python
복사
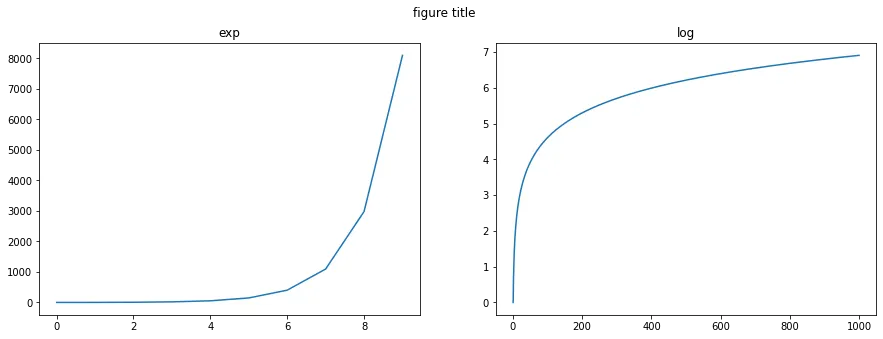
axes의 제목: set_title()
fig , ax = plt.subplots(1,2,figsize=(15,5))
fig.suptitle("figure title")
x = range(0,10) # x축
y = np.exp(x) # y축
ax[0].plot(x,y)
ax[0].set_title("exp")
x = range(1,1000) # x 축
y = np.log(x) # y 축
ax[1].plot(x,y)
ax[1].set_title("log")
plt.show()
Python
복사
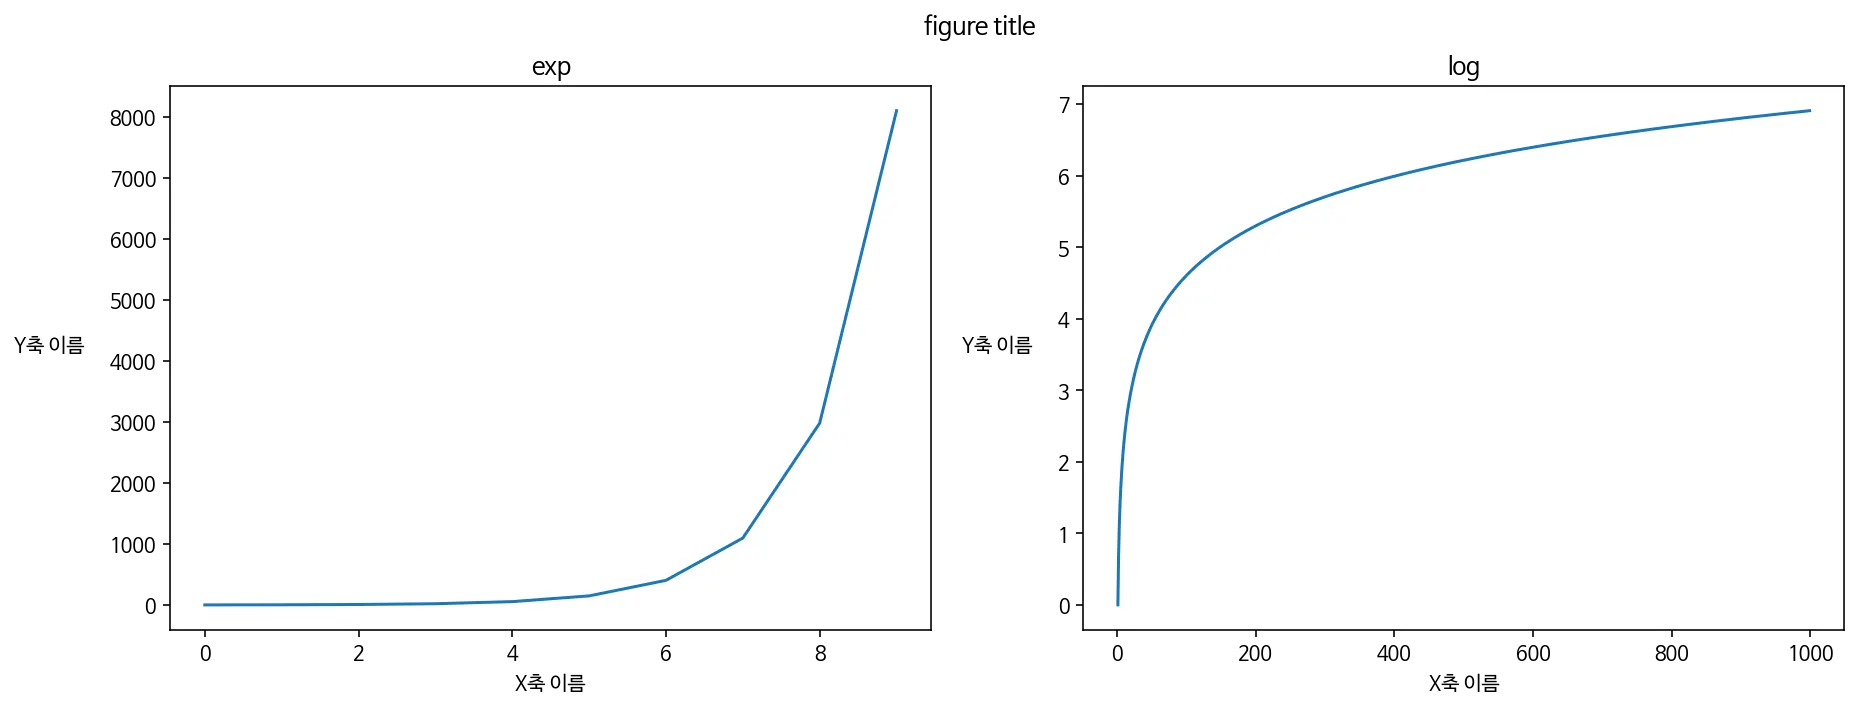
축 제목
•
x축 제목: set_xlabel()
•
y축 제목: set_ylabel()
fig , ax = plt.subplots(1,2,figsize=(15,5))
fig.suptitle("figure title")
x = range(0,10) # x축
y = np.exp(x) # y축
ax[0].plot(x,y)
ax[0].set_title("exp")
ax[0].set_xlabel("X축 이름")
ax[0].set_ylabel("Y축 이름",rotation=0,labelpad=30)
x = range(1,1000) # x 축
y = np.log(x) # y 축
ax[1].plot(x,y)
ax[1].set_title("log")
ax[1].set_xlabel("X축 이름")
ax[1].set_ylabel("Y축 이름",rotation=0,labelpad=30)
plt.show();
Python
복사
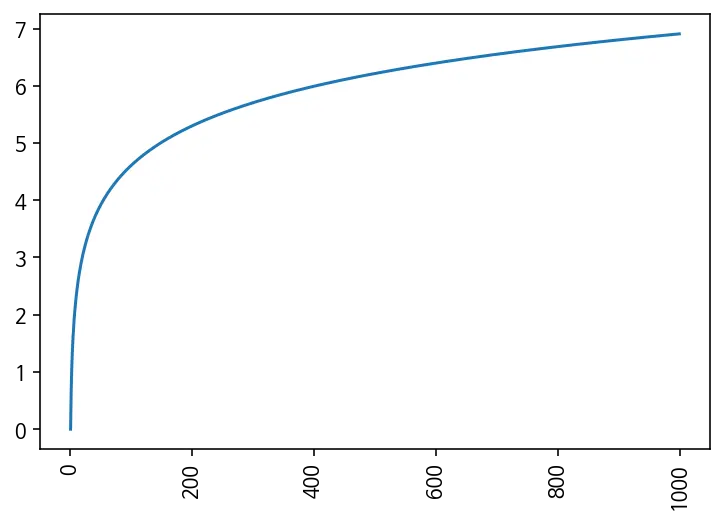
눈금
눈금회전
•
axes의 tick_params()
fig,ax = plt.subplots()
ax.plot(x,y)
# 눈금회전
ax.tick_params(axis="x", labelrotation=90)
plt.show()
Python
복사
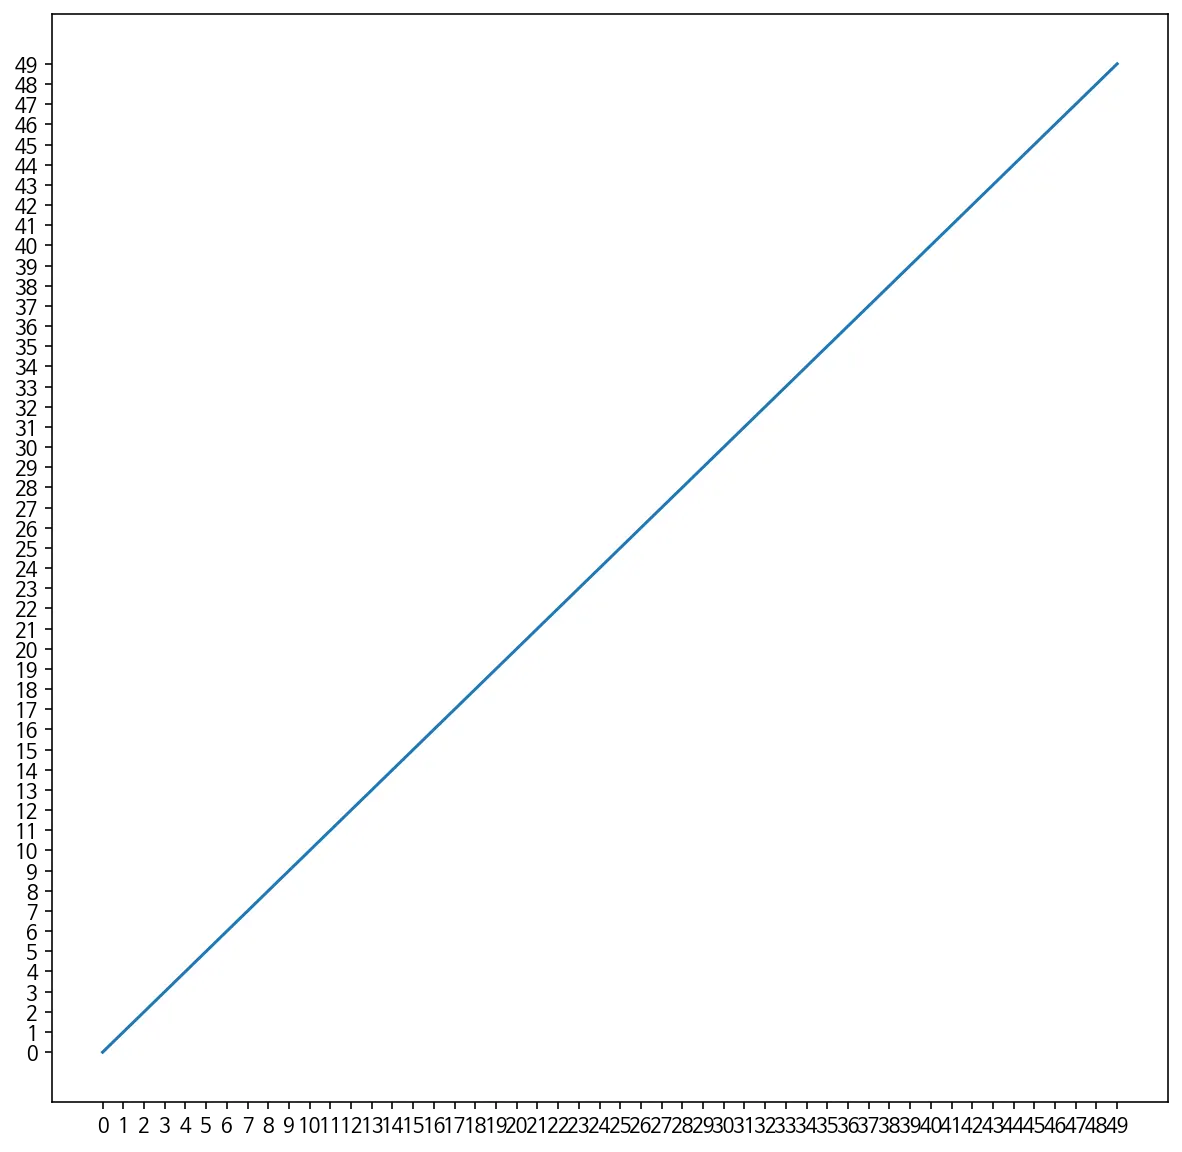
눈금 지정
•
axes의 set_xticks(), set_yticks()
fig,ax = plt.subplots(figsize=[10,10])
ax.plot(range(50))
# 눈금 지정
ax.set_xticks(range(50))
ax.set_yticks(range(50))
plt.show()
Python
복사
그래프 스타일
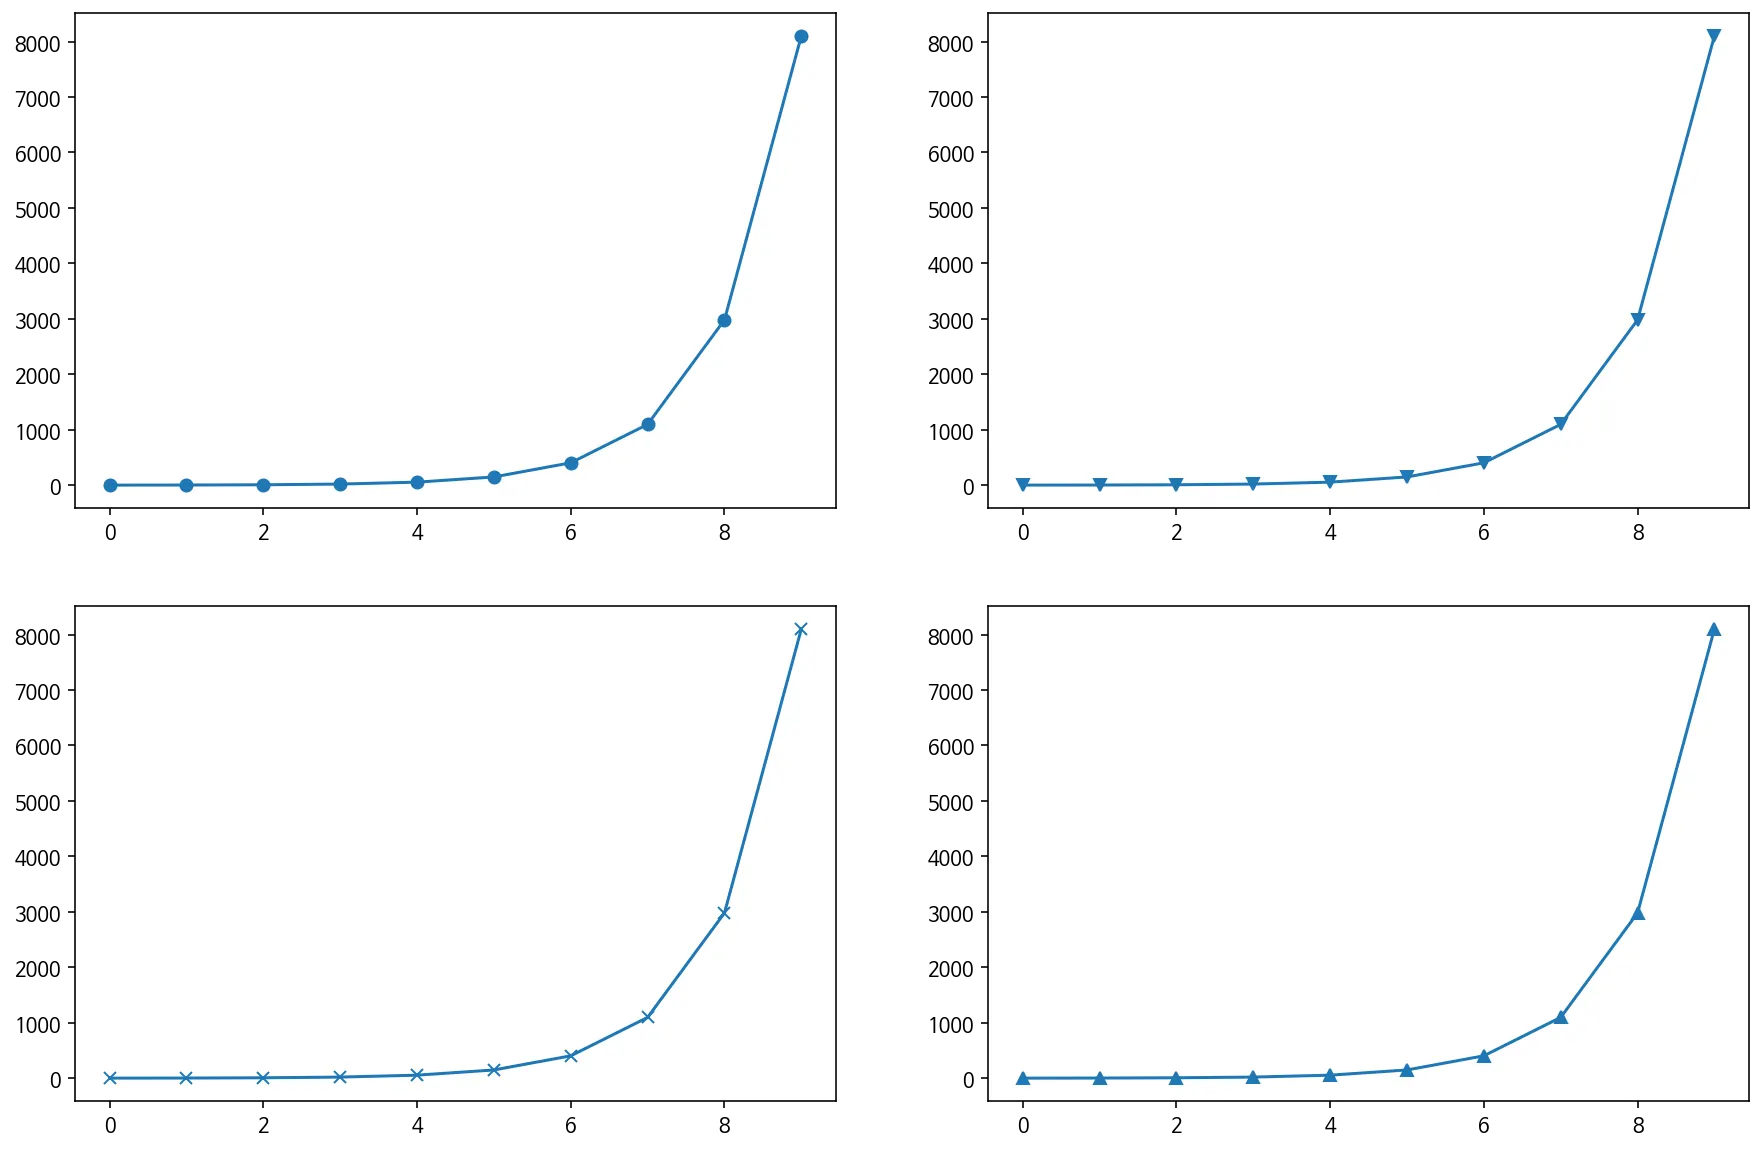
marker
y = np.exp(range(0,10))
fig , ax = plt.subplots(2,2,figsize=[15,10])
# marker
ax[0,0].plot(y,marker="o")
ax[0,1].plot(y,marker="v")
ax[1,0].plot(y,marker="x")
ax[1,1].plot(y,marker="^")
plt.show()
Python
복사
line style
y = np.exp(range(0,10))
fig , ax = plt.subplots(2,2,figsize=[15,10])
# line style
ax[0,0].plot(y,marker="o")
ax[0,1].plot(y,marker="v",linestyle='--')
ax[1,0].plot(y,marker="x",linestyle='')
ax[1,1].plot(y,marker="^")
plt.show()
Python
복사
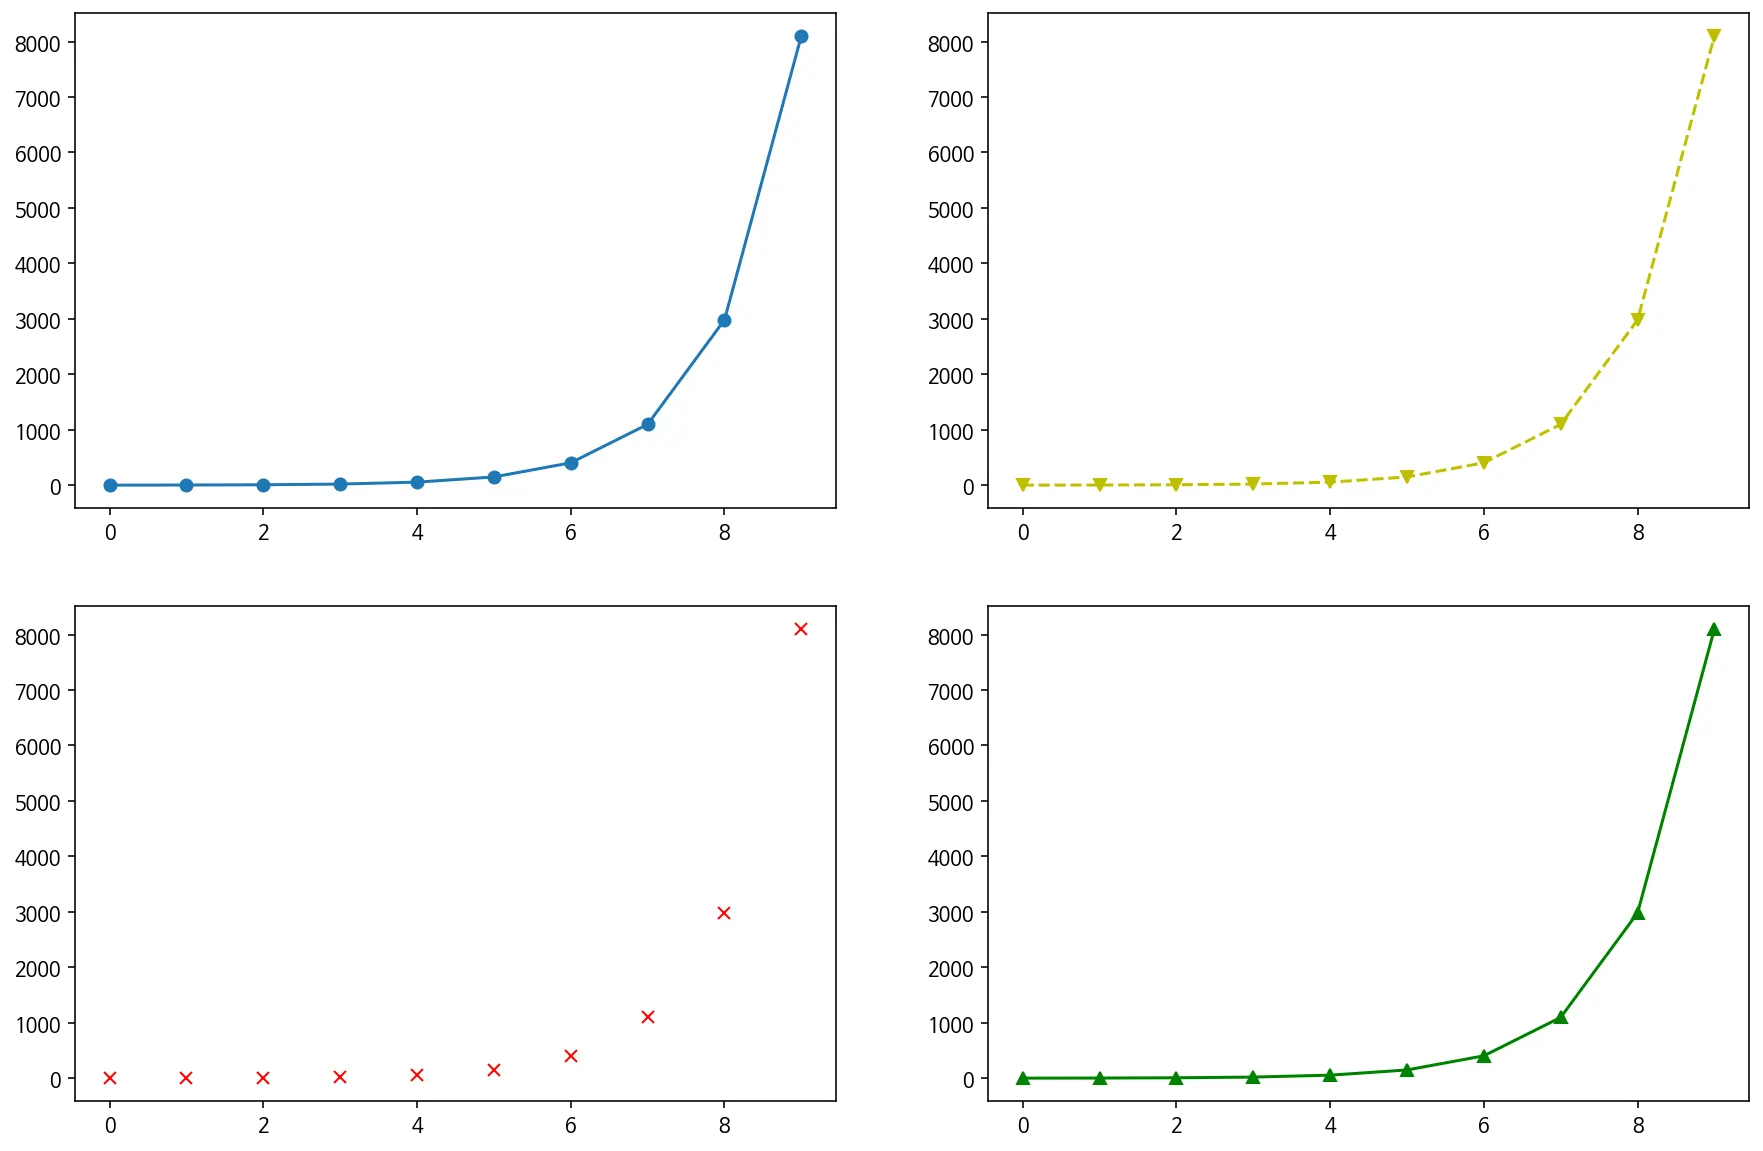
color
y = np.exp(range(0,10))
fig , ax = plt.subplots(2,2,figsize=[15,10])
# color
ax[0,0].plot(y,marker="o")
ax[0,1].plot(y,marker="v",linestyle='--',color="y")
ax[1,0].plot(y,marker="x",linestyle='',color="r")
ax[1,1].plot(y,marker="^",color="g")
plt.show()
Python
복사
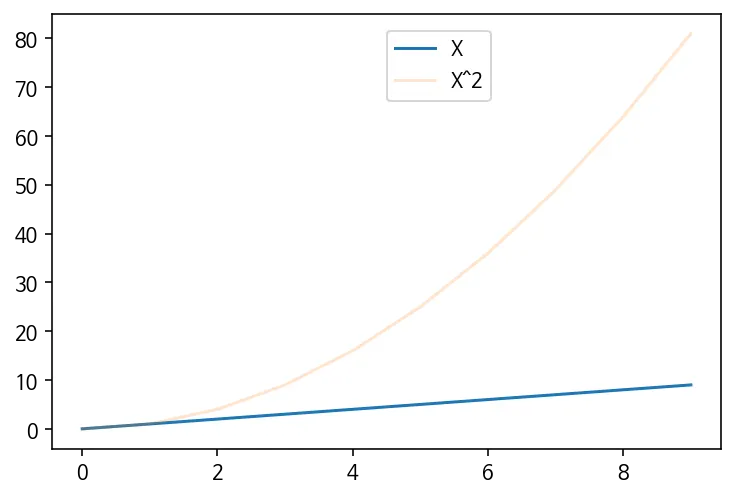
범례 표시
axes의 legend()
fig,ax = plt.subplots()
x = np.arange(10)
ax.plot(x)
ax.plot(x**2,alpha = 0.2) # alpha 투명도 0~1 사이값을 넣어주면된다.
# 범례 표시
ax.legend(["X","X^2"],loc=[0.5,0.8])
plt.show()
Python
복사
심화
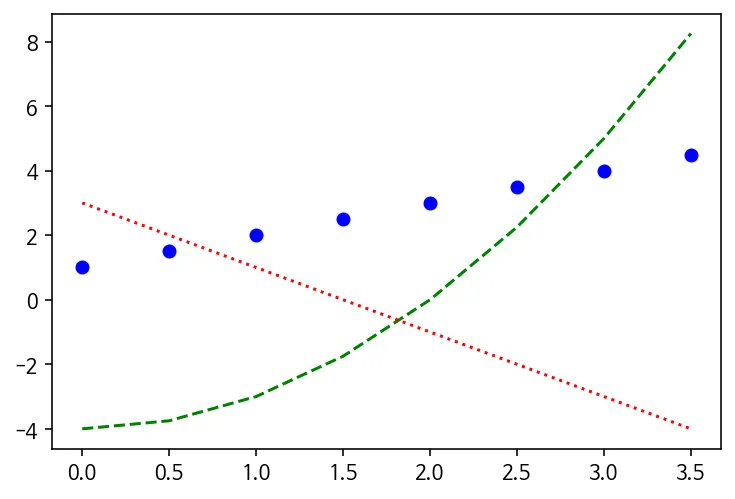
선 그래프
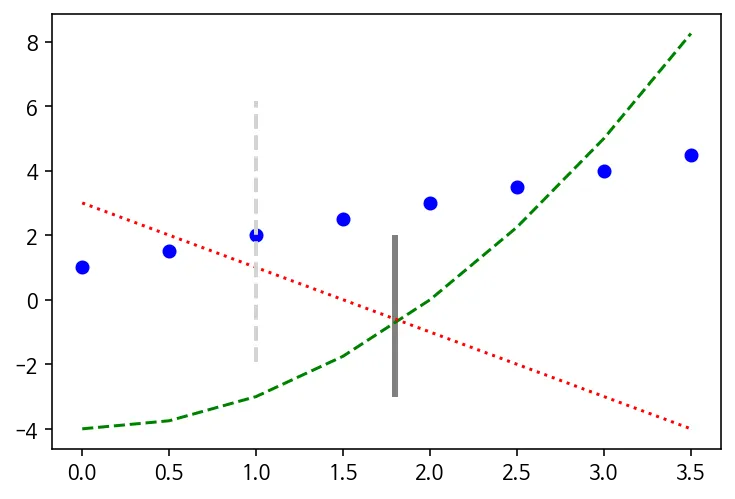
x = np.arange(0, 4, 0.5)
plt.plot(x, x + 1, 'bo')
plt.plot(x, x**2 - 4, 'g--')
plt.plot(x, -2*x + 3, 'r:')
plt.show()
Python
복사
수평선 그리기
•
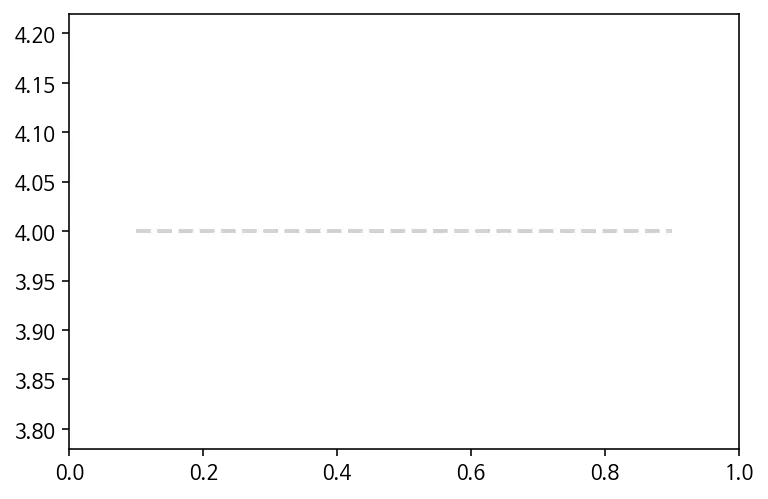
axhline(y, xmin, xmax)
◦
xmin, xmax 값은 0에서 1사이의 값을 입력한다. 0은 왼쪽 끝, 1은 오른쪽 끝을 의미함
plt.axhline(4.0, 0.1, 0.9, color='lightgray', linestyle='--', linewidth=2)
plt.show()
Python
복사
•
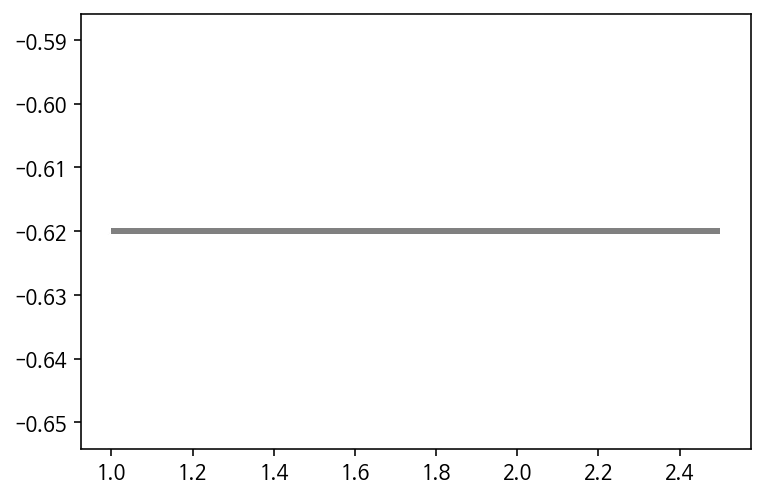
hlines(y, xmin, xmax)
◦
점(xmin,y)에서 점(xmax,y)를 따라 수평선을 표시함
plt.hlines(-0.62, 1.0, 2.5, color='gray', linestyle='solid', linewidth=3)
plt.show()
Python
복사
수직선 그리기
•
axvline(x, ymin, ymax)
•
vlines(x, ymin, ymax)
plt.plot(x, x + 1, 'bo')
plt.plot(x, x**2 - 4, 'g--')
plt.plot(x, -2*x + 3, 'r:')
plt.axvline(1.0, 0.2, 0.8, color='lightgray', linestyle='--', linewidth=2)
plt.vlines(1.8, -3.0, 2.0, color='gray', linestyle='solid', linewidth=3)
plt.show()
Python
복사
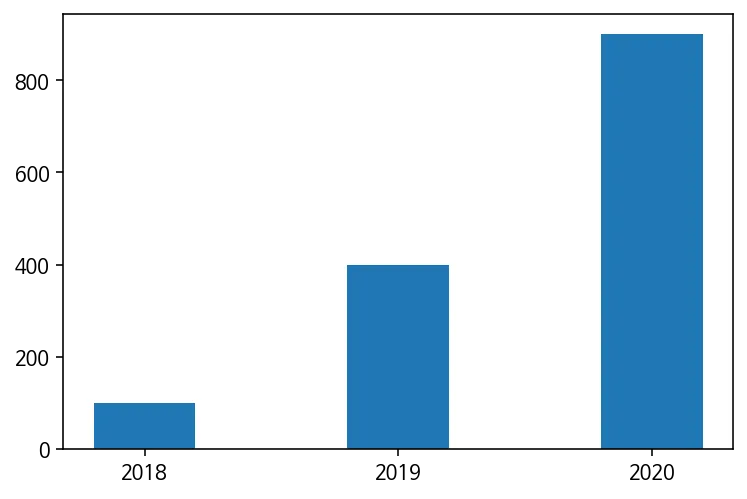
막대 그래프(Bar graph)
•
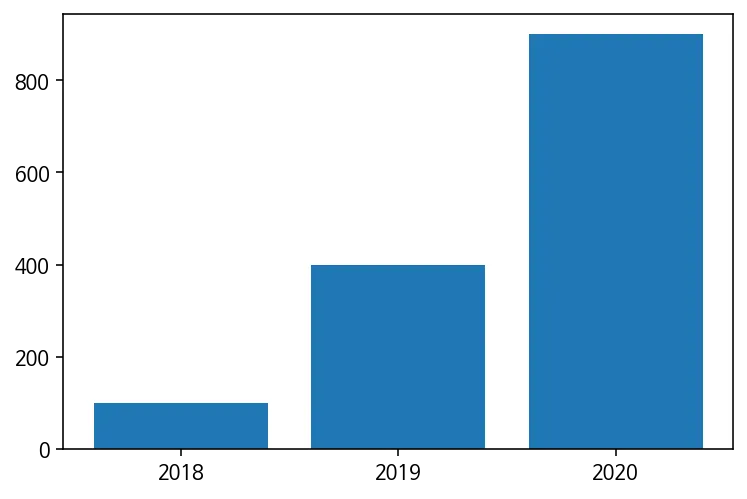
범주가 있는 데이터 값을 직사각형의 막대로 표현하는 그래프
x = np.arange(3)
years = ['2018', '2019', '2020']
values = [100, 400, 900]
plt.bar(x, values)
plt.xticks(x, years)
plt.show()
Python
복사
막대 색상
•
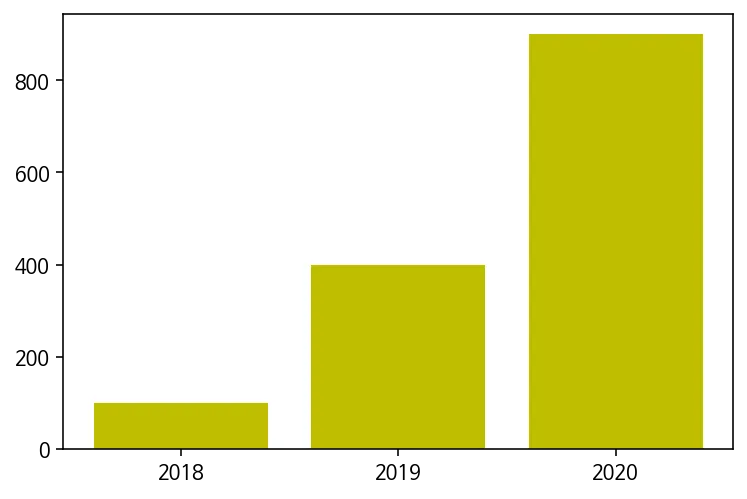
전체 색상 변경
plt.bar(x, values, color='y')
# plt.bar(x, values, color='dodgerblue')
# plt.bar(x, values, color='C2')
# plt.bar(x, values, color='#e35f62')
plt.xticks(x, years)
plt.show()
Python
복사
•
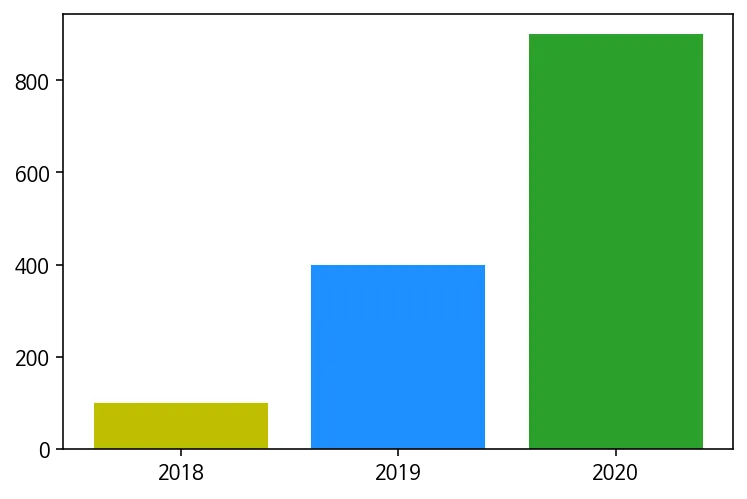
부분 색상 변경
colors = ['y', 'dodgerblue', 'C2']
plt.bar(x, values, color=colors)
plt.xticks(x, years)
plt.show()
Python
복사
•
막대 폭
plt.bar(x, values, width=0.4)
# plt.bar(x, values, width=0.6)
# plt.bar(x, values, width=0.8)
# plt.bar(x, values, width=1.0)
plt.xticks(x, years)
plt.show()
Python
복사
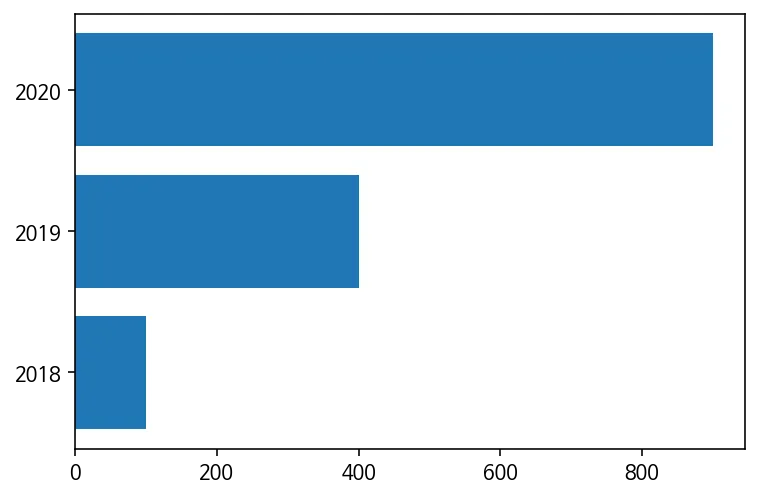
수평 막대 그래프
plt.barh(x, values)
plt.yticks(x, years)
plt.show()
Python
복사
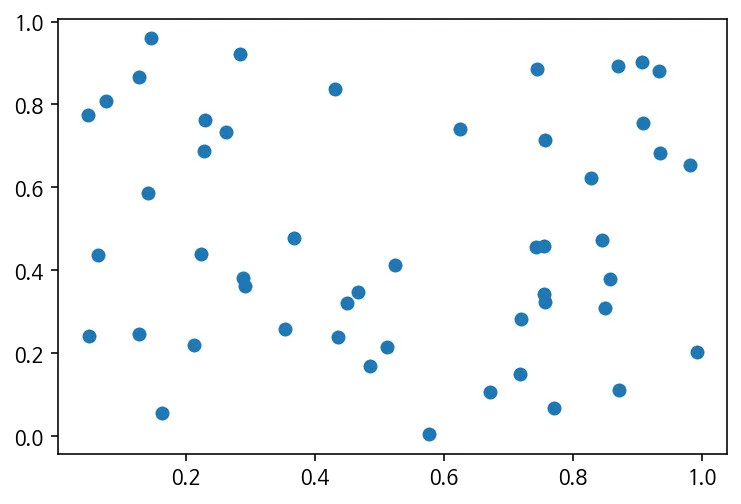
산점도 그리기
•
두 변수의 상관 관계를 직교 좌표계의 평면에 점으로 표현하는 그래프
n = 50
x = np.random.rand(n)
y = np.random.rand(n)
plt.scatter(x, y)
plt.show()
Python
복사
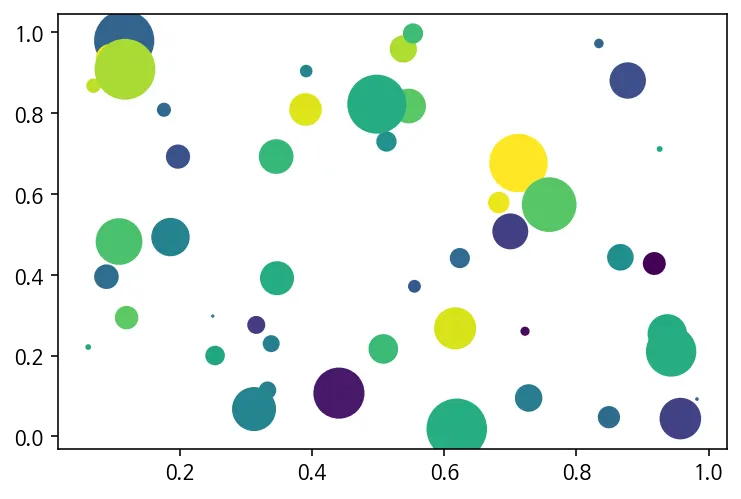
색상과 크기
•
plt.scatter(x, y, s=area, c=colors)
◦
s: size
◦
c: color
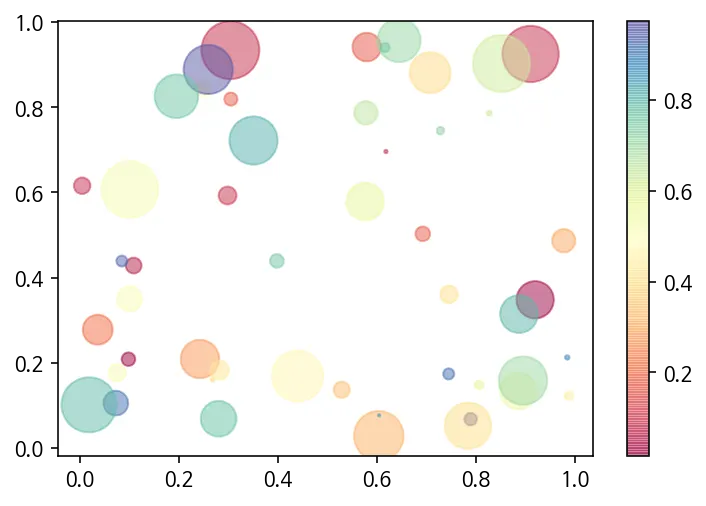
n = 50
x = np.random.rand(n)
y = np.random.rand(n)
area = (30 * np.random.rand(n))**2
colors = np.random.rand(n)
plt.scatter(x, y, s=area, c=colors)
plt.show()
Python
복사
투명도와 컬러맵
•
plt.scatter(x, y, alpha=0.5, cmap='Spectral')
◦
alpha: transparency
◦
cmap: colormap
n = 50
x = np.random.rand(n)
y = np.random.rand(n)
area = (30 * np.random.rand(n))**2
colors = np.random.rand(n)
plt.scatter(x, y, s=area, c=colors, alpha=0.5, cmap='Spectral')
plt.colorbar()
plt.show()
Python
복사
히스토그램(Histogram)
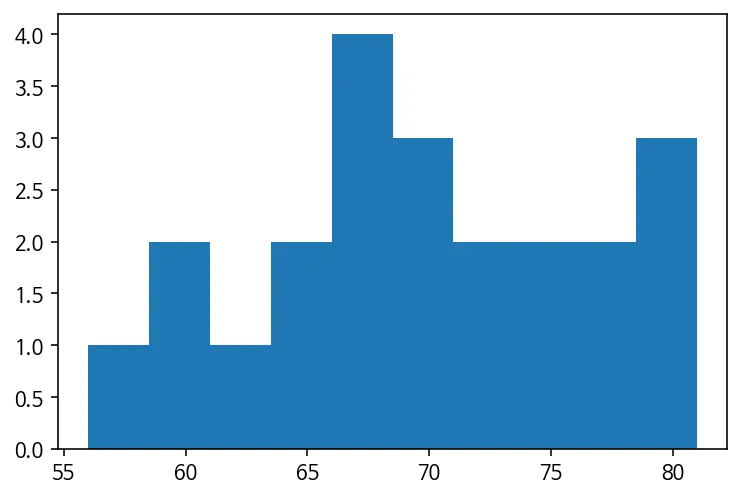
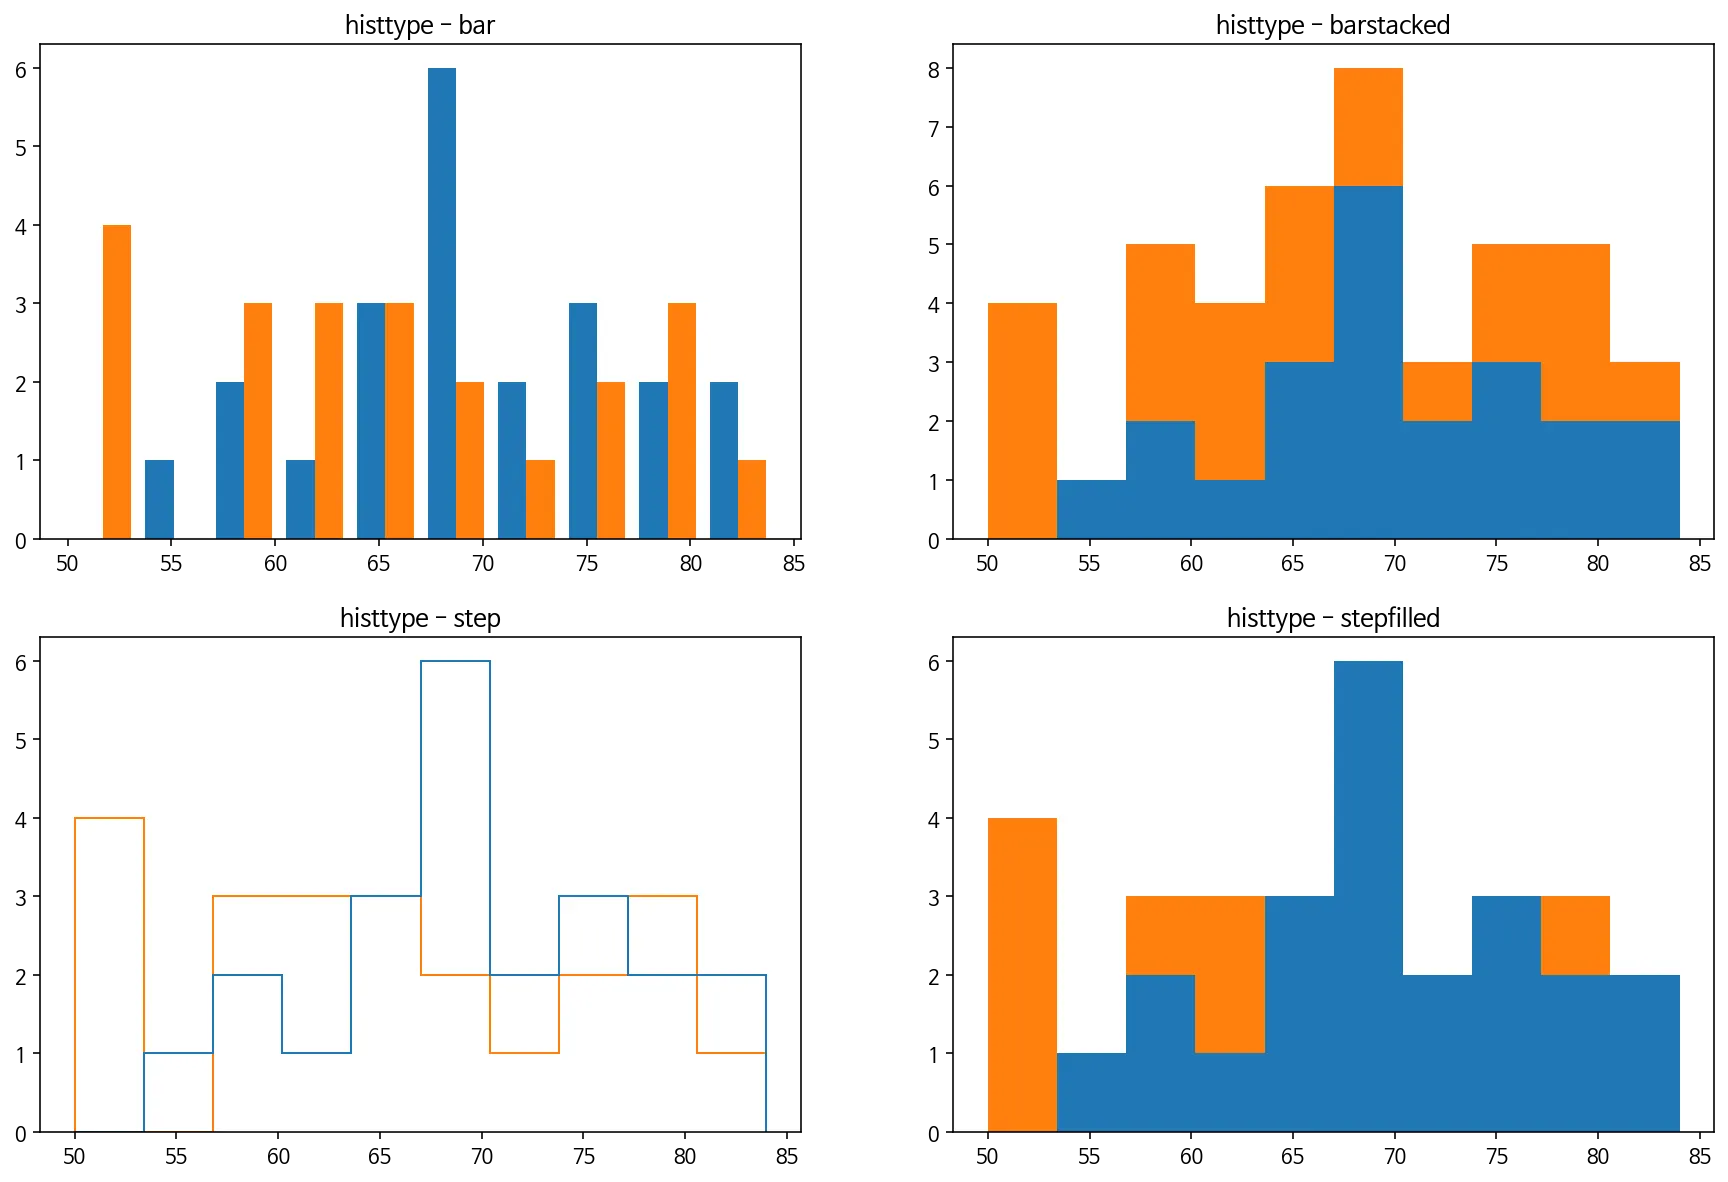
히스토그램은 도수분포표를 그래프로 나타낸 것으로서, 가로축은 계급/구간, 세로축은 도수(횟수나 개수 등)를 나타냄
weight = [68, 81, 64, 56, 78, 74, 61, 77, 66, 68, 59, 71,
80, 59, 67, 81, 69, 73, 69, 74, 70, 65]
plt.hist(weight)
plt.show()
Python
복사
구간 개수 지정하기
•
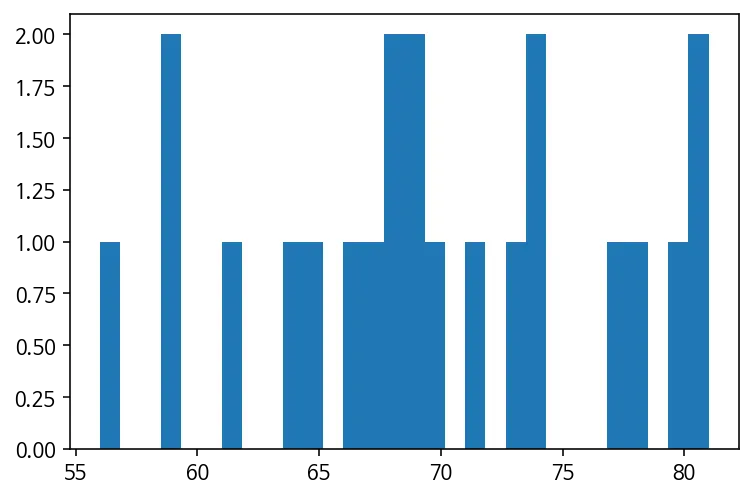
bins 파라미터는 히스토그램의 가로축 구간의 개수를 지정
plt.hist(weight, bins=30)
plt.show()
Python
복사
누적 히스토그램
•
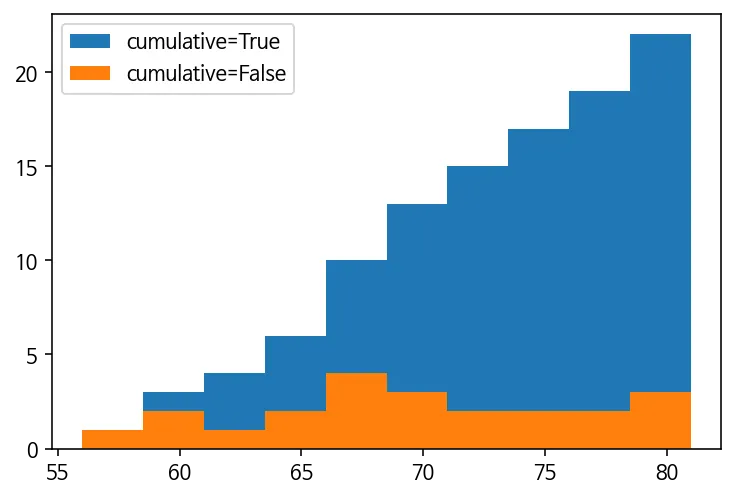
cumulative 파라미터를 True로 지정하면 누적 히스토그램을 나타냄
plt.hist(weight, cumulative=True, label='cumulative=True')
plt.hist(weight, cumulative=False, label='cumulative=False')
plt.legend(loc='upper left')
plt.show()
Python
복사
히스토그램 종류 지정
에러바(오차막대) 표시
•
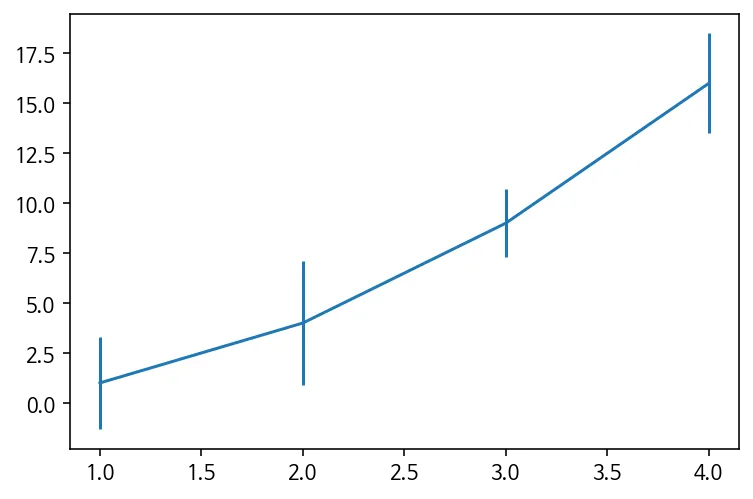
에러바는 데이터의 편차를 표시하기 위한 그래프
x = [1, 2, 3, 4]
y = [1, 4, 9, 16]
yerr = [2.3, 3.1, 1.7, 2.5] # 대칭 편차
plt.errorbar(x, y, yerr=yerr)
plt.show()
Python
복사
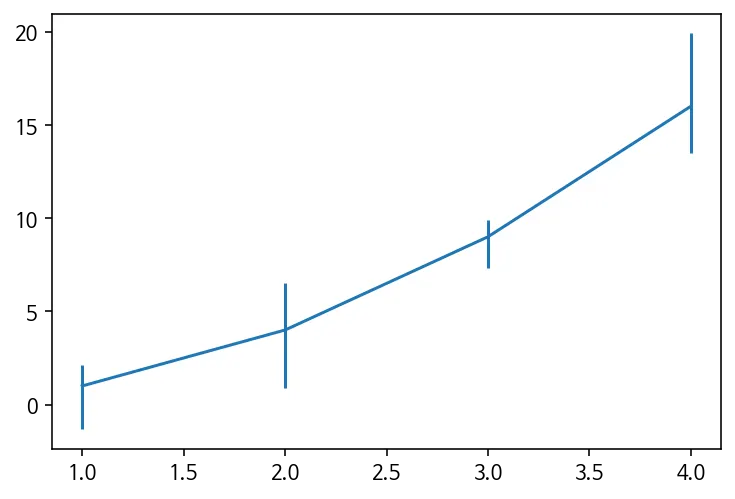
비대칭 편차
yerr = [(2.3, 3.1, 1.7, 2.5), (1.1, 2.5, 0.9, 3.9)]
plt.errorbar(x, y, yerr=yerr)
plt.show()
Python
복사
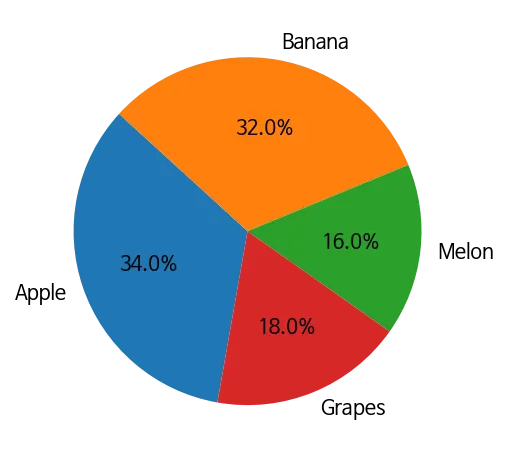
파이 차트(Pie chart, 원 그래프)
•
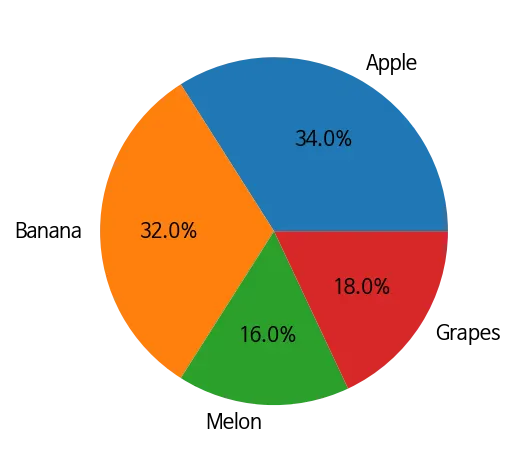
범주별 구성 비율을 원형으로 표현한 그래프
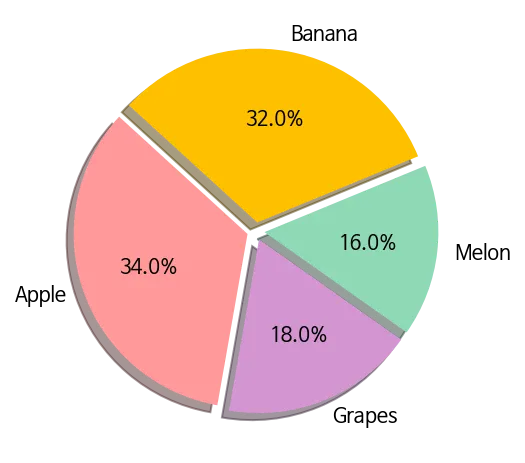
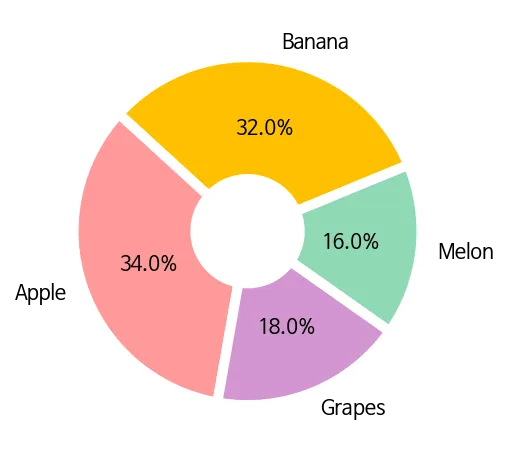
ratio = [34, 32, 16, 18]
labels = ['Apple', 'Banana', 'Melon', 'Grapes']
plt.pie(ratio, labels=labels, autopct='%.1f%%')
plt.show()
Python
복사
시작 각도와 방향 설정
•
plt.pie(ratio, startangle=260, counterclock=False)
◦
startangle: 부채꼴이 그려지는 시작 각도
◦
counterclock=False로 설정하면 시계 방향 순서로 부채꼴 영역이 표시
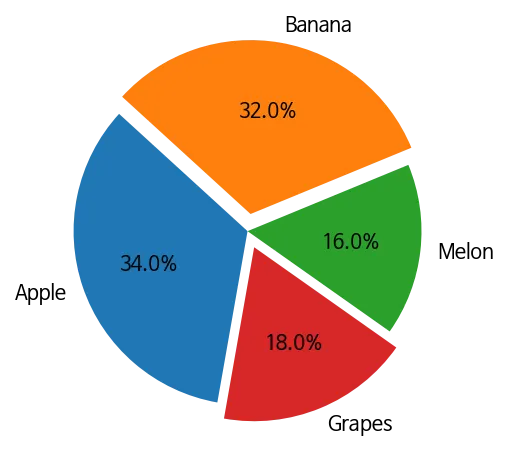
중심에서 벗어나는 정도 설정
•
plt.pie(ratio, explode=[0, 0.1, 0, 0.1])
◦
explode는 부채꼴이 파이 차트의 중심에서 벗어나는 정도
explode = [0, 0.10, 0, 0.10]
plt.pie(ratio, labels=labels, autopct='%.1f%%', startangle=260, counterclock=False, explode=explode)
plt.show()
Python
복사
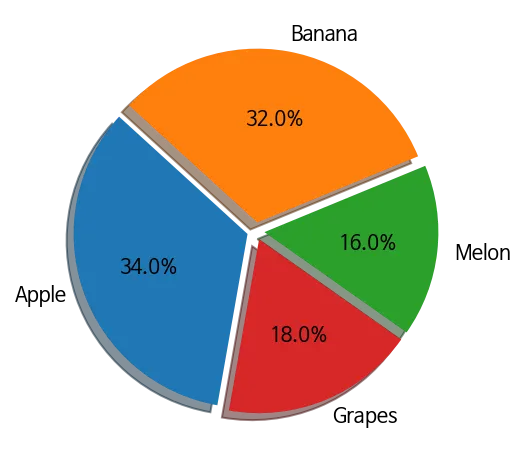
그림자 나타내기
•
plt.pie(ratio, shadow=True)
explode = [0.05, 0.05, 0.05, 0.05]
plt.pie(ratio, labels=labels, autopct='%.1f%%', startangle=260, counterclock=False, explode=explode, shadow=True)
plt.show()
Python
복사
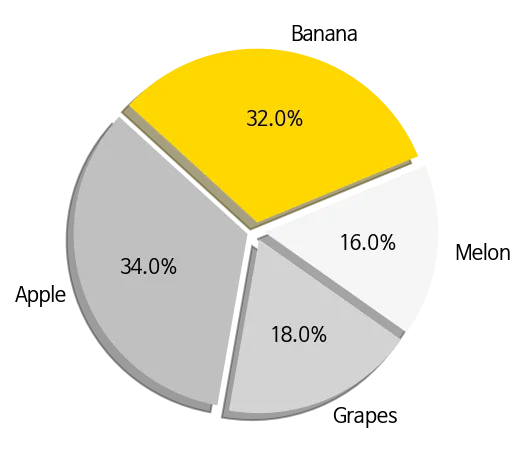
색상 지정하기
•
지정 색상으로 변경
colors = ['silver', 'gold', 'whitesmoke', 'lightgray']
plt.pie(ratio, labels=labels, autopct='%.1f%%', startangle=260, counterclock=False, explode=explode, shadow=True, colors=colors)
plt.show()
Python
복사
•
색상코드로 지정
colors = ['#ff9999', '#ffc000', '#8fd9b6', '#d395d0']
plt.pie(ratio, labels=labels, autopct='%.1f%%', startangle=260, counterclock=False, explode=explode, shadow=True, colors=colors)
plt.show()
Python
복사
부채꼴 스타일 지정
wedgeprops={'width': 0.7, 'edgecolor': 'w', 'linewidth': 5}
plt.pie(ratio, labels=labels, autopct='%.1f%%', startangle=260, counterclock=False, colors=colors, wedgeprops=wedgeprops)
plt.show()
Python
복사
히트맵
•
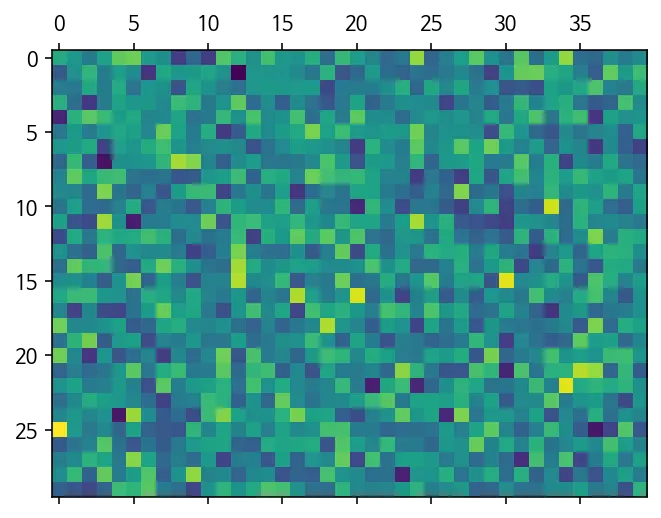
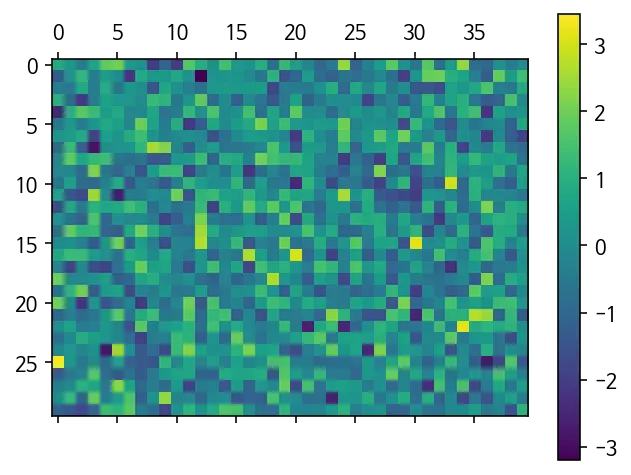
다양한 값을 갖는 숫자 데이터를 열분포 형태와 같이 색상을 이용해서 시각화한 것
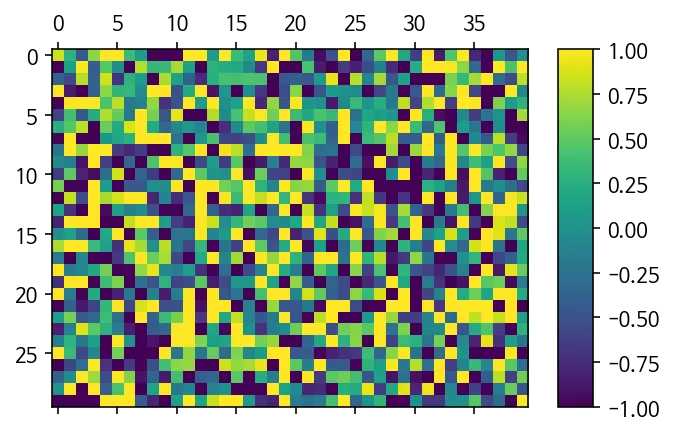
arr = np.random.standard_normal((30, 40))
plt.matshow(arr)
plt.show()
Python
복사
컬러바 나타내기
plt.matshow(arr)
plt.colorbar()
plt.show()
Python
복사
색상 범위 지정
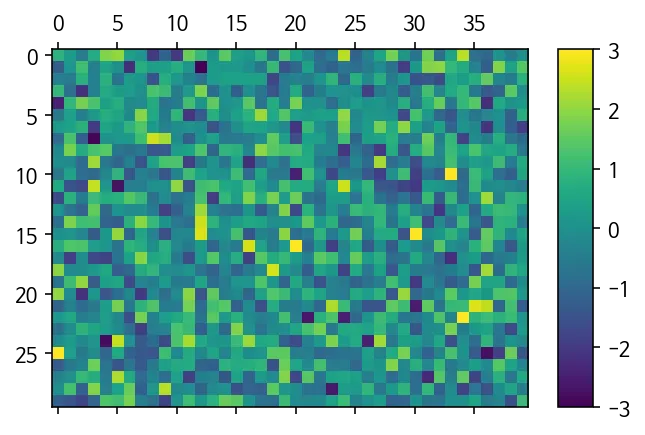
•
진하게
plt.matshow(arr)
plt.colorbar(shrink=0.8, aspect=10)
plt.clim(-1.0, 1.0)
plt.show()
Python
복사
•
연하게
plt.matshow(arr)
plt.colorbar(shrink=0.8, aspect=10)
plt.clim(-3.0, 3.0)
plt.show()
Python
복사
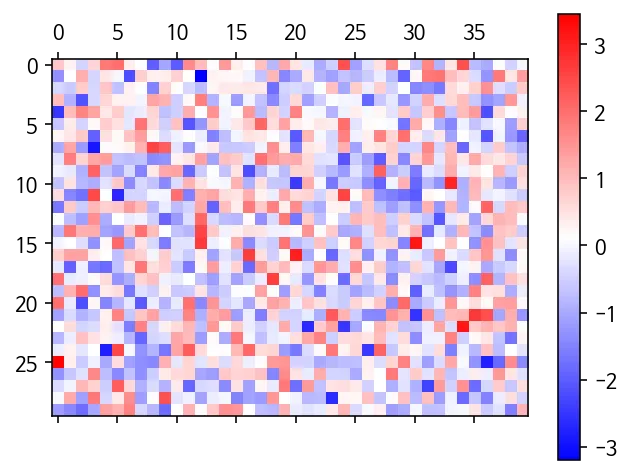
•
컬러맵 지정
# cmap = plt.get_cmap('PiYG')
# cmap = plt.get_cmap('BuGn')
# cmap = plt.get_cmap('Greys')
cmap = plt.get_cmap('bwr')
plt.matshow(arr, cmap=cmap)
plt.colorbar()
plt.show()
Python
복사
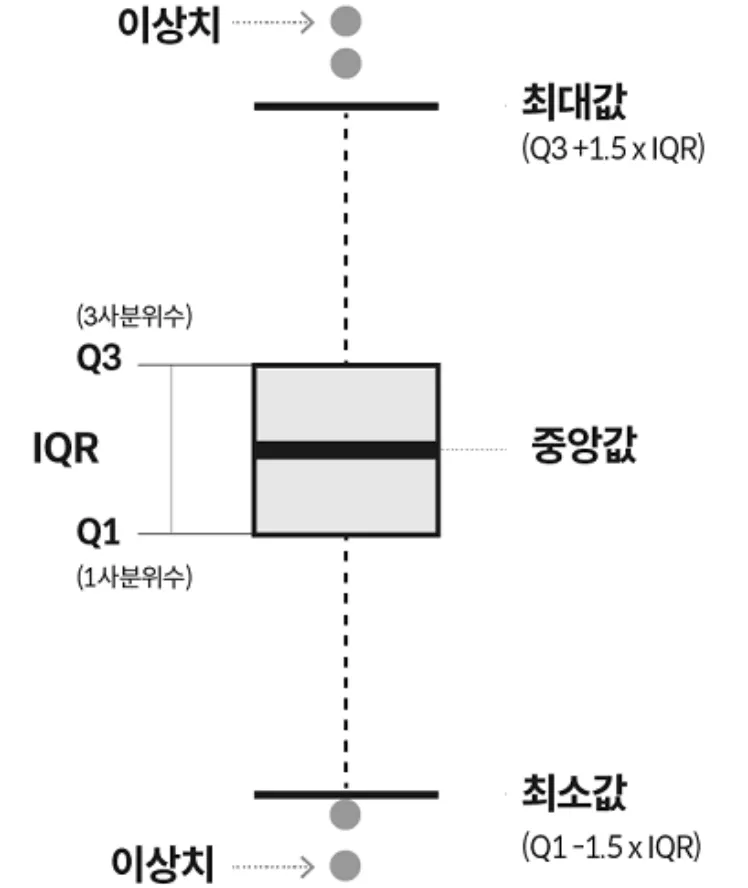
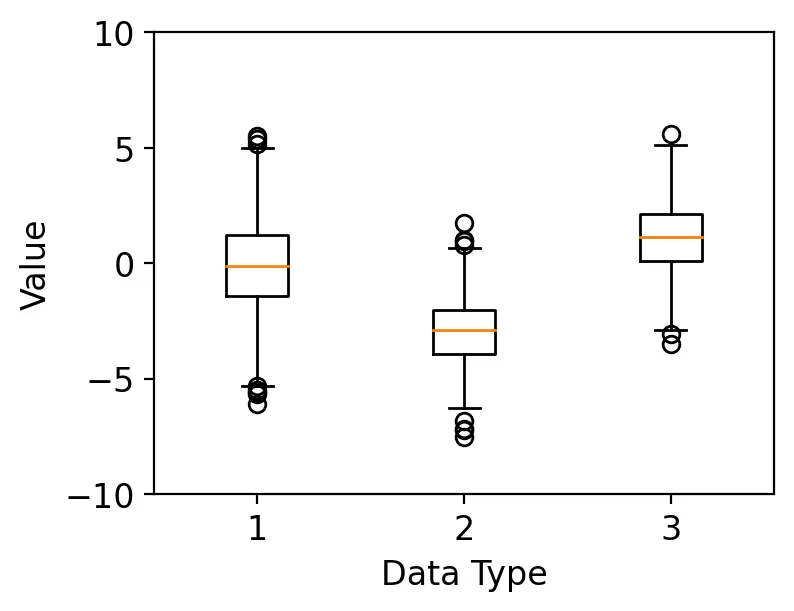
박스 플롯 그리기
•
수치 데이터를 표현하는 그래프
•
일반적으로 박스플롯은 전체 데이터로부터 얻어진 아래의 다섯 가지 요약 수치를 사용
◦
최소값
◦
제 1사분위 수(Q1)
◦
제 2사분위 수 또는 중위수(Q2)
◦
제 3사분위 수(Q3)
◦
최대값
# 1. 기본 스타일 설정
plt.style.use('default')
plt.rcParams['figure.figsize'] = (4, 3)
plt.rcParams['font.size'] = 12
# 2. 데이터 준비
np.random.seed(0)
data_a = np.random.normal(0, 2.0, 1000)
data_b = np.random.normal(-3.0, 1.5, 500)
data_c = np.random.normal(1.2, 1.5, 1500)
# 3. 그래프 그리기
fig, ax = plt.subplots()
ax.boxplot([data_a, data_b, data_c])
ax.set_ylim(-10.0, 10.0)
ax.set_xlabel('Data Type')
ax.set_ylabel('Value')
plt.show()
Python
복사
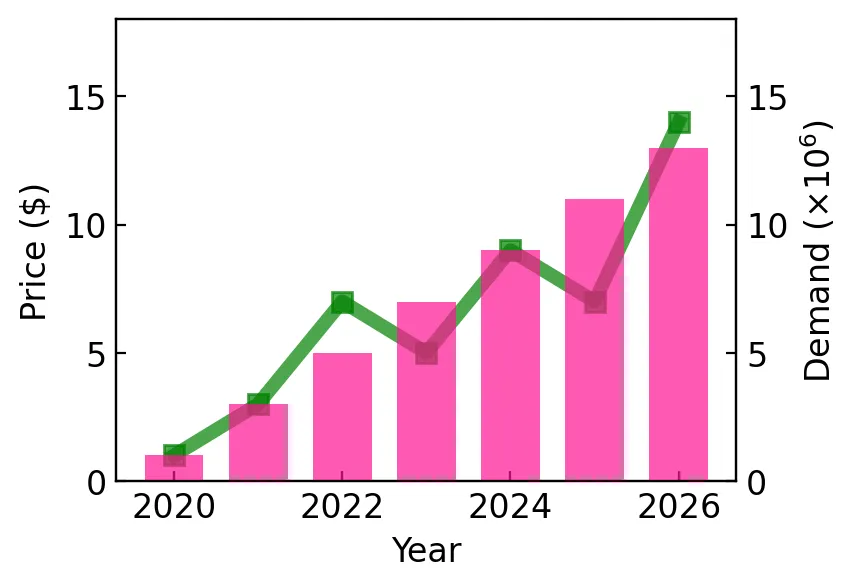
두 종류의 그래프 그리기
1.
우선 ax1.twinx()로 x축을 공유하는 이중 y축을 만든다.
2.
ax1.plot()과 ax2.bar()를 사용해서 y1, y2 데이터를 각각 꺾은선 그래프와 막대 그래프의 형태로 나타낸다.
# 1. 기본 스타일 설정
plt.style.use('default')
plt.rcParams['figure.figsize'] = (4, 3)
plt.rcParams['font.size'] = 12
# 2. 데이터 준비
x = np.arange(2020, 2027)
y1 = np.array([1, 3, 7, 5, 9, 7, 14])
y2 = np.array([1, 3, 5, 7, 9, 11, 13])
# 3. 그래프 그리기
fig, ax1 = plt.subplots()
ax1.plot(x, y1, '-s', color='green', markersize=7, linewidth=5, alpha=0.7, label='Price')
ax1.set_ylim(0, 18)
ax1.set_xlabel('Year')
ax1.set_ylabel('Price ($)')
ax1.tick_params(axis='both', direction='in')
ax2 = ax1.twinx()
ax2.bar(x, y2, color='deeppink', label='Demand', alpha=0.7, width=0.7)
ax2.set_ylim(0, 18)
ax2.set_ylabel(r'Demand ($\times10^6$)')
ax2.tick_params(axis='y', direction='in')
plt.show()
Python
복사
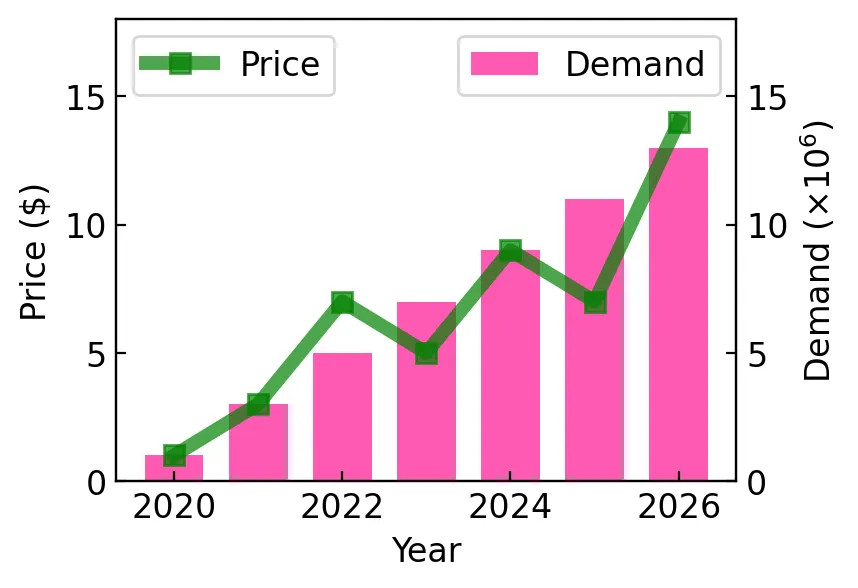
그래프 순서 지정
# 1. 기본 스타일 설정
plt.style.use('default')
plt.rcParams['figure.figsize'] = (4, 3)
plt.rcParams['font.size'] = 12
# 2. 데이터 준비
x = np.arange(2020, 2027)
y1 = np.array([1, 3, 7, 5, 9, 7, 14])
y2 = np.array([1, 3, 5, 7, 9, 11, 13])
# 3. 그래프 그리기
fig, ax1 = plt.subplots()
ax1.plot(x, y1, '-s', color='green', markersize=7, linewidth=5, alpha=0.7, label='Price')
ax1.set_ylim(0, 18)
ax1.set_xlabel('Year')
ax1.set_ylabel('Price ($)')
ax1.tick_params(axis='both', direction='in')
ax2 = ax1.twinx()
ax2.bar(x, y2, color='deeppink', label='Demand', alpha=0.7, width=0.7)
ax2.set_ylim(0, 18)
ax2.set_ylabel(r'Demand ($\times10^6$)')
ax2.tick_params(axis='y', direction='in')
# 4. 그래프 순서 지정
ax1.set_zorder(ax2.get_zorder() + 10)
ax1.patch.set_visible(False)
ax1.legend(loc='upper left')
ax2.legend(loc='upper right')
plt.show()
Python
복사

